


 15 May 2018
2018- n° 124In April 2018, consumer prices rose by 0.2% over one month and by 1.6% year on year Consumer price index - final results - April 2018
15 May 2018
2018- n° 124In April 2018, consumer prices rose by 0.2% over one month and by 1.6% year on year Consumer price index - final results - April 2018
In April 2018, the Consumer Prices Index (CPI) decelerated to +0.2% over one month, after a rebound in March (+1.0%). This slowdown resulted from those, marked and seasonal, in “manufactured product” prices (+0.1% after +2.1%) after a rebound in March due to the end of winter sales. The prices of services (+0.1% after +0.4%) and food (+0.1% after +0.4%) rose less than in March too. On the other hand, energy prices sharply rebounded (+0.9% after −0.7%) in the wake of petroleum product prices.
Monthly change: 0.2% in April; Year-on-year change: +1.6%
In April 2018, the Consumer Prices Index (CPI) decelerated to +0.2% over one month, after a rebound in March (+1.0%). This slowdown resulted from those, marked and seasonal, in “manufactured product” prices (+0.1% after +2.1%) after a rebound in March due to the end of winter sales. The prices of services (+0.1% after +0.4%) and food (+0.1% after +0.4%) rose less than in March too. On the other hand, energy prices sharply rebounded (+0.9% after −0.7%) in the wake of petroleum product prices.
Seasonally adjusted, consumer prices slowed down: +0.1% after a +0.5% rebound in March.
Year on year, consumer prices increased by 1.6%, as in the previous month. Energy prices sharply accelerated and those of food rose barely more than in March. Services prices rose at the same pace than in the previous month and those of “manufactured products” fell as in March.
Slight drop in core inflation year on year
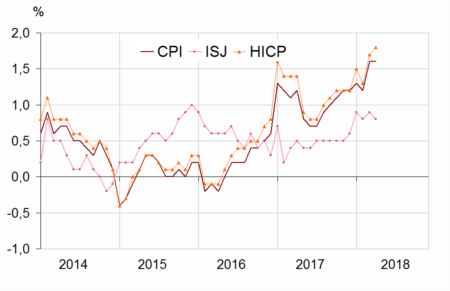
Year on year, core inflation barely dropped: +0.8% after +0.9% in the previous month. The Harmonised Index of Consumer Prices (HICP) sharply slowed down to +0.2% after +1.1% in March; year on year, it grew by 1.8%, after +1.7% in the previous month.
Acceleration in energy prices year on year
Energy infation sharply gathered pace in April 2018 (+6.3% year on year after +5.0%), due to a stronger rise in petroleum product prices (+10.7% year on year after +8.1%) in the wake of Brent prices and the implementation of the TICPE for liquid fuels (butane, propane) since the 1st April. On the other hand, gas prices slightly slowed down (+0.5% year on year after +0.8%).
tableauTable1 – Detailed figures for various groups
| Items | Weight | Index | Percentage change | |
|---|---|---|---|---|
| 2018 | April 2018 | m-on-m change(2) | y-on-y change(3) | |
| a) All households | ||||
| Overall | 10000 | 102.92 | 0.2 | 1.6 |
| Overall SA(1) | 10000 | 102.73 | 0.1 | 1.7 |
| Food | 1627 | 102.72 | 0.1 | 1.6 |
| Fresh food | 243 | 109.76 | −0.1 | 3.9 |
| Other food | 1384 | 101.59 | 0.1 | 1.2 |
| Tobacco | 193 | 119.96 | 0.0 | 16.5 |
| Manufactured products | 2594 | 99.41 | 0.1 | −0.3 |
| Clothing and footwear | 416 | 103.64 | 0.8 | −0.6 |
| Medical products | 425 | 92.84 | −0.3 | −2.4 |
| Other manufactured products | 1753 | 100.06 | 0.0 | 0.2 |
| Energy | 777 | 110.54 | 0.9 | 6.3 |
| Petroleum products | 408 | 116.54 | 2.0 | 10.7 |
| Services | 4809 | 103.08 | 0.1 | 1.4 |
| Actual rentals and services for dwellings | 764 | 101.69 | 0.0 | 0.5 |
| Health services | 617 | 102.40 | −0.2 | 1.7 |
| Transport | 282 | 102.99 | 4.4 | 1.2 |
| Communication | 223 | 99.12 | 0.0 | −0.5 |
| Other services | 2923 | 103.93 | −0.2 | 1.7 |
| Total except rents and tobacco | 9192 | 102.71 | 0.2 | 1.4 |
| Total except tobacco | 9807 | 102.59 | 0.2 | 1.3 |
| b) Urban working-class households or households of employees | ||||
| All products excluding tobacco | 9706 | 102.46 | 0.2 | 1.3 |
| c) Households that belong to the lowest equivalized disposable income quintile - France | ||||
| All products excluding tobacco | 9700 | 102.36 | 0.3 | 1.3 |
- (1) seasonally adjusted
- (2) [m/(m-1)]
- (3) [m/(m-12)]
- Geographical coverage: France excluding Mayotte
- Source: INSEE - Consumer Price Indices
Slight rise in food inflation
In April 2018, food prices rose by 1.6% year on year, barely more than in March (+1.5%). The prices of fresh products sharply accelerated after a rebound in March (+3.9% year on year after +2.8%), in line with a stronger rise in prices of fresh fishes (+2.4% after +1.0%), fresh vegetables (+5.8% after +4.2%) and fresh fruits (+6.8% after +6.2%). Excluding fresh products, food prices were up by 1.2% year on year, as in February and March.
Tobacco prices increased by 16.5% year on year after +16.6% in March.
Stability in services inflation
Year on year, services prices rose by 1.4% as in March. Airfares sharply fell back (−0.9% year on year after +1.0%): over a month, the seasonal rebound was less pronounced than in April 2017 (+9.0% against +11.1%). Moreover, the prices of health services (+1.7% year on year after +2.0%), those of actual rentals and services for dwellings (+0.5% after +0.6%) and accommodation services (+3.2% after +5.6%) slowed down. On the other hand, the prices of passager transport by road strongly gathered pace (+4.3% year on year after +1.8%): air and rail transport users have turned to these services due to strikes. Insurance prices rose too stronger (+2.3% after +2.0%). Lastly, communication services prices decreased by 0.5% year on year, as in March.
Further drop in manufactured products prices year on year
Year on year, “manufactured product” prices dropped by 0.3% for the second consecutive month. Clothing and footwear prices dropped a little more than in March (−0.6% year on year after −0.5%), due to a slowdown in footwear prices (+0.1% after +0.6%) whereas clothing prices dropped by 0.8% as in March. The prices of “other manufactured products” barely decelerated (+0.2% year on year after +0.3% in the four previous months). Motor cars prices rose more moderately (+1.0% year on year after +1.2%) and those in furniture were stable after +0.2% in March. The drop in information-processing equipment prices was stronger (−4.0% after −3.6%). On the other hand, household appliances prices fell less than in the previous month (−1.2% year on year after −1.9%), as prices in equipment for sport (−0.4% after −0.6%). Moreover, heatlh product prices dropped at the same pace as in February and March (−2.4% year on year).
graphiqueGraph1 – Consumer Price Index (CPI), core inflation (ISJ) (1) and Harmonised Index of Consumer Prices (HICP) (2) year-on-year changes
tableauTable2 – Detailed figures for Core inflation (1) and HICP (2)
| Items | Weight | Index | Percentage change | |
|---|---|---|---|---|
| 2018 | April 2018 | m-on-m change(3) | y-on-y change(4) | |
| Core inflation - All items | 6041 | 101.84 | 0.1 | 0.8 |
| Food excluding fresh products, meat, milk and exotic products | 740 | 101.08 | 0.0 | 0.7 |
| Manufactured products | 2125 | 99.80 | 0.1 | 0.1 |
| Services including actual rentals and services for dwellings | 3176 | 103.42 | 0.1 | 1.4 |
| HICP - All items | 103.43 | 0.2 | 1.8 | |
- (1) Core inflation indicator excludes public sector prices, the most volatile consumer prices and the tax measures. Seasonally adjusted, this index is calculated for all households in France excluding overseas departments and territories. (in French “indice d'inflation sous-jacent - ISJ”)
- (2) HICP: Harmonised Indices of Consumer Prices are inflation figures designed for international comparison between Member states of the European Union. This index is calculated for all households in France excluding Mayotte.
- (3) [m/(m-1)]
- (4) [m/(m-12)]
- Source: INSEE - Consumer Price Indices
Revisions
Compared with the provisional estimates published on April 27, 2018, the month-on-month changes in the CPI and in the HICP are up by 0.1points. Their year-on-year changes are confirmed.
Documentation
Methodology (pdf,141 Ko)
Pour en savoir plus
