


 6 March 2018
2018- n° 59In January 2018, agricultural prices fell by 1.1% over one year Indices of agricultural prices - January 2018
6 March 2018
2018- n° 59In January 2018, agricultural prices fell by 1.1% over one year Indices of agricultural prices - January 2018
In January 2018, agricultural products prices decreased by 1.1% over one year (after +0.3%). Excluding fruits and vegetables, they went down by 1.0% over one month and by 0.6% over one year (after +0.5%).

Information : in accordance with the European directives, index of producer prices of agricultural products and indices of purchase prices of the means of agricultural production are disseminated in reference year 2015=100 from the current issue. Additional information about changes of the base year indices is available on the Web page of these indicators (flag: Documentation).
In January 2018, agricultural products prices decreased by 1.1% over one year (after +0.3%). Excluding fruits and vegetables, they went down by 1.0% over one month and by 0.6% over one year (after +0.5%).
New Decline in prices for cereals and oilseeds
In January 2018, soft wheat prices decreased by 0.7% over a month and by 10.5% over a year because of the dollar fall against the euro and because of better than expected outlook for production in the United States. Grain maize prices went also down by 2.2% in one month. Oilseeds prices continue to slide over a month (−3.8% after −3.3%) and over a year (−18.4%) as supply exceeded demand.
graphiqueGraph1 – Producer prices of cereals
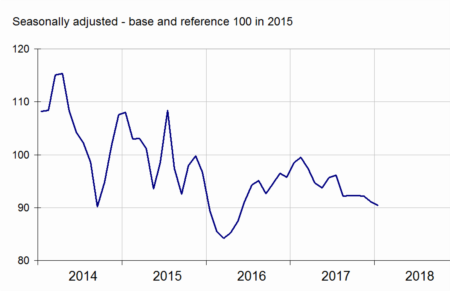
- Source: INSEE
Fresh vegetables prices down, fresh fruits up
In January 2018, fresh vegetables prices dropped by 23.4% over a year due to cauliflower and salad prices. Prices for fresh fruit increased by 15.5% over a year, pulled up by those of kiwifruit, clementines, apples and pears.
graphiqueGraph2 – Producer prices of fresh vegetables
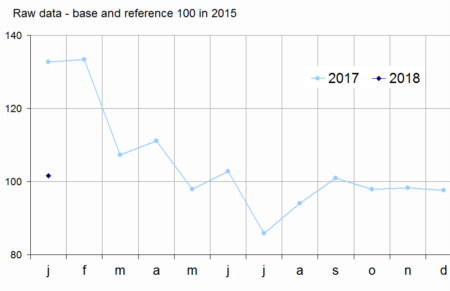
- Source: SSP (ministry in charge of agriculture)
Animals prices fell down
Animal prices decreased by 1.2% in January 2018. Pig prices lost 2.7% over a month which deepened their decline over a year (−13.5%). Prices for cattle faltered for the third consecutive month (−1.2% in January) but still increased over one year (+2.1%).
graphiqueGraph3 – Producer prices of pigs and large cattle
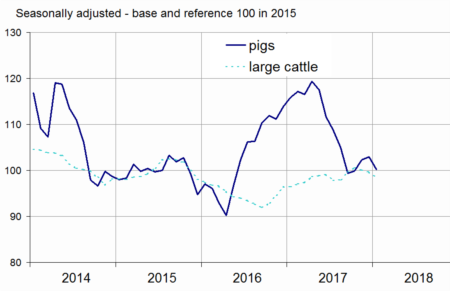
- Source: INSEE
Egg prices slipped back
After rising for several months due to the fipronil crisis, egg prices fell sharply in January (−12.6% over one month). They remained up by 67.7% over one year. Prices of cow's milk increased by 10.7% over one year in December in connection with the huge rise in butter prices.
tableautable1 – Index of producer prices of agricultural products (IPPAP)
| Variation as % over | |||||
|---|---|---|---|---|---|
| Weights | Jan 2018 | a month | 3 months | a year | |
| Agricultural goods output | 1000 | 103.6 | /// | /// | –1.1 |
| excluding fruits and vegetables | 906 | 103.5 | –1.0 | 0.0 | –0.6 |
| Crop output (excluding fruits and vegetables) | 489 | 101.8 | –0.4 | 0.0 | –4.7 |
| Cereals | 152 | 90.5 | –0.5 | –2.0 | –8.1 |
| of which soft wheat | 90 | 89.1 | –0.7 | –3.2 | –10.5 |
| grain maize | 27 | 95.0 | –2.2 | +0.7 | –10.8 |
| Potatoes | 29 | 120.3 | /// | /// | –32.0 |
| Wines | 200 | 110.4 | +0.3 | +2.6 | +6.7 |
| protected designation of origin | 112 | 119.5 | +0.4 | +3.5 | +10.9 |
| other wines | 25 | 94.3 | +0.2 | +5.4 | +3.2 |
| Oleaginous | 40 | 89.3 | –3.8 | –4.6 | –18.4 |
| Horticultural products | 35 | 103.5 | –0.1 | +0.3 | –1.2 |
| Other crop products | 33 | 99.4 | 0.0 | –4.6 | –4.9 |
| Fruits and vegetables (1) | 94 | 105.3 | /// | /// | –6.6 |
| Fresh vegetables | 45 | 101.6 | /// | /// | –23.4 |
| Fresh fruits | 32 | 120.6 | /// | /// | +15.5 |
| Animal output | 417 | 105.4 | –1.6 | –0.1 | +4.4 |
| Animals | 255 | 98.8 | –1.2 | –1.2 | –2.0 |
| of which large cattle | 112 | 98.5 | –1.2 | –2.2 | +2.1 |
| calves | 20 | 100.5 | –1.1 | –0.4 | +0.8 |
| pigs | 49 | 100.2 | –2.7 | +0.3 | –13.5 |
| sheep | 14 | 98.6 | –1.7 | –0.2 | +4.9 |
| poultry | 57 | 97.4 | –0.2 | –1.1 | –1.2 |
| of which chicken | 39 | 97.2 | –0.3 | –1.2 | –1.2 |
| Milk | 146 | 108.6 | /// | 0.0 | +8.1 |
| of which cow milk (2) | 135 | 109.2 | /// | 0.0 | +8.7 |
| Eggs | 16 | 179.9 | –12.6 | +8.4 | +67.7 |
- * cf. methodological note
- /// Absence of meaning due to the nature of these series
- (1) Including vegetables for industry.
- (2) The December value of cow milk price index has been carried forward in January. The previous month variation is the one commented in the text: +10,7% over one year in December 2017.
- Sources: INSEE, SSP (ministry in charge of agriculture)
Increase of purchase prices of means of production over a year
Intermediate consumption prices went up by 0.9% over a month in January 2018. Energy prices bounced back: +4.3% over one month after −0.1% in December (+6.5% over a year after +2.0%). Fertilizers and amendments prices went up by 0.7% over one month while animal feeds prices increased by 0.5%. Capital goods prices were nearly unchanged in January (−0.1%) and rose by 2.7% over one year.
graphiqueGraph4 – Purchase prices of the means of agricultural production
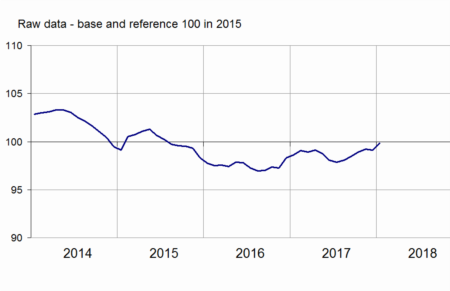
- Sources: INSEE, SSP (ministry in charge of agriculture)
tableautable2 – Indices of purchase prices of the means of agricultural production (IPAMPA)
| Variation as % over | |||||
|---|---|---|---|---|---|
| Weights | Jan 2018 | a month | 3 months | a year | |
| Total input | 1000 | 99.8 | +0.7 | +0.9 | +1.2 |
| Intermediate consumptions | 760 | 98.5 | +0.9 | +1.1 | +0.7 |
| Energy | 93 | 111.9 | +4.3 | +7.6 | +6.5 |
| Seeds | 56 | 96.3 | –0.1 | –0.7 | –0.6 |
| Fertilisers and soil improvers | 107 | 87.3 | +0.7 | +2.1 | –0.5 |
| Plant protection products | 84 | 97.1 | –0.1 | –1.8 | –1.4 |
| Animal feed | 214 | 94.8 | +0.5 | –0.1 | –1.0 |
| Veterinary expenses | 37 | 105.7 | +0.1 | +0.3 | +1.8 |
| Small equipment and tools | 11 | 99.2 | +0.3 | +0.6 | –0.7 |
| Maintenance of materials | 88 | 103.7 | +0.9 | +1.1 | +2.4 |
| Maintenance of buildings | 9 | 103.2 | 0.0 | 0.0 | +1.2 |
| Other goods and services | 61 | 102.1 | +0.2 | +0.2 | +0.3 |
| Goods and services contributing to investment | 240 | 103.9 | –0.1 | +0.2 | +2.7 |
| Material | 168 | 103.8 | –0.1 | +0.2 | +2.5 |
| Tractors | 71 | 106.4 | +0.1 | –0.2 | +4.6 |
| Machinery and equipment for cultivation | 38 | 103.5 | –0.1 | +0.9 | +2.4 |
| Machinery and equipment for harvesting | 38 | 102.2 | –0.1 | +0.3 | +0.1 |
| Utility vehicles | 16 | 99.0 | –0.8 | –0.2 | –0.4 |
| Buildings | 72 | 104.1 | 0.0 | 0.0 | +3.2 |
- (1) The repayment of the domestic tax on energy product (TICPE) benefiting farmers has been applied in advance for the year 2018.
- Sources: INSEE, SSP (ministry in charge of agriculture)
Pour en savoir plus
Time series : Indices of agricultural prices
