


 22 February 2018
2018- n° 43In February 2018, the business climate in services falters again Monthly survey of services - February 2018
22 February 2018
2018- n° 43In February 2018, the business climate in services falters again Monthly survey of services - February 2018
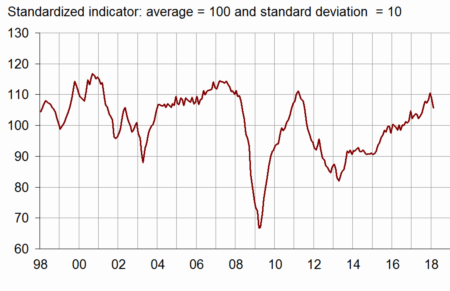
According to business managers surveyed in February 2018, the business climate in services is less favourable than the previous month. The business climate composite indicator has lost three points after a first decline of two points last month. However, at 106, it remains well above its long-term average (100).
- Less optimism on business and demand prospects
- In road transport, the business climate has improved anew
- In accommodation and food services, the business climate remains very favourable
- The business climate has weakened again in information and communication
- In real estate activities, the business climate remains deteriorated
- The business climate has worsened in professional activities
- The business climate is less favourable in administrative and support service activities
According to business managers surveyed in February 2018, the business climate in services is less favourable than the previous month. The business climate composite indicator has lost three points after a first decline of two points last month. However, at 106, it remains well above its long-term average (100).
graphiqueGraph1 – Business climate composite indicator
The turning point indicator has moved into the area indicating an uncertain short-term economic situation for the first time since November 2016.
graphiqueGraph2 – Turning point indicator
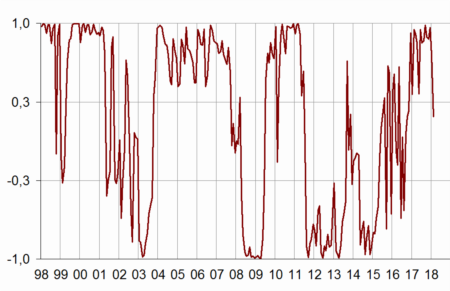
- Note: close to 1 (respectively –1), this indicator indicates a favourable short-term economic situation (respectively unfavourable). The uncertainty area is between –0.3 and +0.3.
Less optimism on business and demand prospects
The balances of opinion on past and expected activity, expected demand and on general outlook have decreased in February. The balance on expected activity has even moved back below its long-term average. Nevertheless, the other balances remain clearly above their average.
Concerning the employment in services including temporary work agencies, the balance of opinion on past employment has increased and exceeds its average level even more. By contrast, that on expected employment has decreased again. However, the corresponding balance of opinion is still above its average.
The balances of opinion on investments have risen, the one on expected investments returning above its long-term average.
tableauTable1_month – Economic outlook in the services sector
| Average* | Nov. 17 | Dec. 17 | Jan. 18 | Feb. 18 | |
|---|---|---|---|---|---|
| Composite indicator | 100 | 108 | 111 | 109 | 106 |
| General outlook | –7 | 3 | 4 | 5 | 4 |
| Past activity | 2 | 12 | 15 | 14 | 9 |
| Expected activity | 2 | 8 | 10 | 4 | 0 |
| Expected demand | –1 | 7 | 8 | 8 | 4 |
| Past selling prices | –4 | 0 | –1 | 0 | –2 |
| Expected selling prices | –3 | –2 | –3 | –2 | –5 |
| Past employment | 3 | 12 | 13 | 10 | 13 |
| except temporary work agencies | 1 | 6 | 4 | 4 | 5 |
| Expected employment | 2 | 5 | 12 | 9 | 6 |
| except temporary work agencies | –1 | 2 | 3 | 5 | 3 |
| Investments | |||||
| Past investments | 2 | 6 | 3 | 4 | 7 |
| Expected investments | 1 | 7 | 1 | 1 | 5 |
- * Average since 1989 for the composite indicator and since 1988 for the balances of opinion
- Source: INSEE, monthly business survey in services.
The business climate composite indicator has decreased in information-communication, in professional, scientific and technical activities and in administrative and support service activities. It has improved only in road transport. Nevertheless, the business climate remains over its long-term average in each sub- sector, except in real estate activities where it stands significantly below its average.
In road transport, the business climate has improved anew
In road transport, the climate indicator has bounced back. At 114, it stands markedly above its average level. The balances on expected activity and demand have increased sharply; the latter one has even reached a record level. The balance on expected employment has gone down steeply but remains above its average.
In accommodation and food services, the business climate remains very favourable
The climate in accommodation and food services is virtually stable in February, at a high level (112). The decrease in the balance on expected demand has been almost offset by the rise in the one on past employment. All balances are above their long-term average.
The business climate has weakened again in information and communication
In information and communication, the business climate has weakened for the second consecutive month, losing three points in February (102). The balances on past and expected activity and on expected demand have fallen significantly and stand at or above their long-term mean from now on. However, the balances of opinion on general outlook and on expected employment have slightly increased.
In real estate activities, the business climate remains deteriorated
In February, the business climate is stable in real estate activity (85) after a fall last month due to the sub-sector of housing rental. However, the business managers have been less pessimistic concerning their expected activity, whereas the balances on general outlook and expected demand have decreased.
The business climate has worsened in professional activities
The business climate in professional, scientific and technical activities has lost three points (108) but remains well above its average level. The balances of opinion on general outlook, activity and expected demand have decreased. However, all the balances are above their long-term average.
The business climate is less favourable in administrative and support service activities
After a rise for six months in a row, the business climate has lost three points in administrative and support service activities. This decline is due to the decrease in the balances on general outlook and expected demand, activity and employment. Nevertheless, at 110, it stands well above its average.
tableauTable2 – Business climate composite indicator and balances of opinion by sub-sector in services
| Aggregated classification (NA 2008) at level A21 | Mean* | Nov. 17 | Dec. 17 | Jan. 18 | Feb. 18 |
|---|---|---|---|---|---|
| Road transport (8%) | |||||
| Composite indicator | 100 | 114 | 113 | 111 | 114 |
| Past activity | –7 | 9 | 13 | 13 | 13 |
| Expected activity | –8 | 14 | 11 | 3 | 10 |
| Expected demand | –10 | 15 | 12 | 11 | 20 |
| Past employment | –6 | 15 | 15 | 11 | 11 |
| Expected employment | –9 | 4 | 5 | 7 | –1 |
| General outlook | –21 | 9 | 8 | 11 | 13 |
| Accommodation and food service activities (11%) | |||||
| Composite indicator | 100 | 107 | 112 | 113 | 112 |
| Past activity | –7 | 0 | 13 | 8 | 6 |
| Expected activity | –7 | –1 | 0 | –1 | 0 |
| Expected demand | –10 | –6 | 1 | –1 | –3 |
| Past employment | –4 | 3 | –4 | 0 | 8 |
| Expected employment | –6 | –6 | –2 | –6 | –5 |
| General outlook | –14 | –3 | –1 | 9 | 9 |
| Information and communication (24%) | |||||
| Composite indicator | 100 | 107 | 107 | 105 | 102 |
| Past activity | 8 | 27 | 21 | 22 | 8 |
| Expected activity | 9 | 17 | 21 | 9 | –6 |
| Expected demand | 10 | 10 | 11 | 6 | –2 |
| Past employment | 6 | 12 | 13 | 18 | 18 |
| Expected employment | 11 | 15 | 14 | 15 | 16 |
| General outlook | 0 | 7 | 8 | 3 | 4 |
| Real estate activities (13%) | |||||
| Composite indicator | 100 | 88 | 92 | 85 | 85 |
| Past activity | 7 | 15 | 10 | 13 | 11 |
| Expected activity | 7 | –8 | –8 | –18 | –10 |
| Expected demand | 1 | 0 | 6 | 4 | 1 |
| Past employment | 3 | –3 | 6 | 5 | 0 |
| Expected employment | 2 | 8 | 5 | –2 | –4 |
| General outlook | –2 | –17 | –13 | –13 | –17 |
| Professional, scientific and technical activities (24%) | |||||
| Composite indicator | 100 | 110 | 111 | 111 | 108 |
| Past activity | –1 | 2 | 10 | 7 | 1 |
| Expected activity | –2 | 7 | 6 | 6 | 5 |
| Expected demand | –5 | 5 | 3 | 5 | 3 |
| Past employment | 1 | 7 | 10 | 12 | 9 |
| Expected employment | 0 | 9 | 12 | 11 | 11 |
| General outlook | –9 | 3 | 3 | 4 | 1 |
| Administrative and support service activities (18%) | |||||
| Composite indicator | 100 | 110 | 112 | 113 | 110 |
| Past activity | 6 | 11 | 16 | 23 | 23 |
| Expected activity | 5 | 12 | 14 | 14 | 11 |
| Expected demand | 3 | 16 | 18 | 22 | 14 |
| Past employment | 10 | 25 | 26 | 17 | 23 |
| Expected employment | 8 | 8 | 23 | 14 | 8 |
| General outlook | –4 | 12 | 13 | 13 | 11 |
- The figures in parentheses indicate the weights used to aggregate the sub-sector balances of opinion.
- *Composite indicator: average since 1989 (2006 for road transport); balances of opinion: average since 1988 (2006 for road transport)
- Source: INSEE, monthly business survey in services.
Documentation
Abbreviated Methodology (2017) (pdf,177 Ko)
Pour en savoir plus
Time series : Economic outlook surveys – Services
