


 22 February 2018
2018- n° 44In February 2018, the business climate remains favourable in retail trade and in trade
and repair of motor vehicles Monthly survey of retailing - February 2018
22 February 2018
2018- n° 44In February 2018, the business climate remains favourable in retail trade and in trade
and repair of motor vehicles Monthly survey of retailing - February 2018
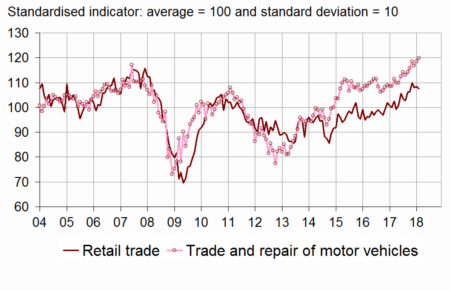
According to the managers in retail trade and in trade and repair of motor vehicles, the business climate remains favourable in February 2018. The composite indicator that measures it is stable, at 114. It remains significantly above its long-term average (100), that it has reached or exceeded since February 2015.
According to the managers in retail trade and in trade and repair of motor vehicles, the business climate remains favourable in February 2018. The composite indicator that measures it is stable, at 114. It remains significantly above its long-term average (100), that it has reached or exceeded since February 2015.
graphiqueChart_1 – Business climate synthetic indicator

Declining ordering intentions
Slightly fewer managers than in January have declared a rise in their recent sales. For the next months, the balance about ordering intentions has declined for the third month in a row and the one on expected sales is practically stable. The balance concerning general business outlook has decelerated a little for two months. Nevertheless, these four balances remain above their average.
Stocks have been estimated practically stable, slightly above their standard level.
More traders than in January have expected to increase their prices on the next three months. The corresponding balance has reached its highest level since April 2012.
tableauTable_1 – Tendency in retail trade and in trade and repair of motor vehicles
| Ave. (1) | Nov. 17 | Dec. 17 | Jan. 18 | Feb. 18 | |
|---|---|---|---|---|---|
| Business climate | 100 | 116 | 114 | 114 | 114 |
| General business outlook | –29 | 1 | 4 | 3 | 2 |
| Recent sales | –6 | –7 | 0 | 4 | 2 |
| Expected sales | –2 | 15 | 10 | 10 | 9 |
| Ordering intentions | –8 | 11 | 6 | 5 | 2 |
| Stocks | 11 | 10 | 9 | 12 | 13 |
| Past selling prices (2) | –6 | –1 | 5 | ||
| Expected selling prices | –3 | 2 | 0 | –1 | 3 |
| Cash position (2) | –15 | –11 | –15 | ||
| Workforce size: recent trend | 1 | 7 | 0 | 5 | 2 |
| Workforce size: future trend | –3 | 0 | 0 | –1 | 2 |
- (1) Average since 1991 (2004 for recent and expected sales and ordering intentions).
- (2) Bi-monthly question (odd-numbered months).
- Source: INSEE - monthly survey in retail trade and in trade and repair of motor vehicles
graphiqueChart_2 – Recent sales and ordering intentions
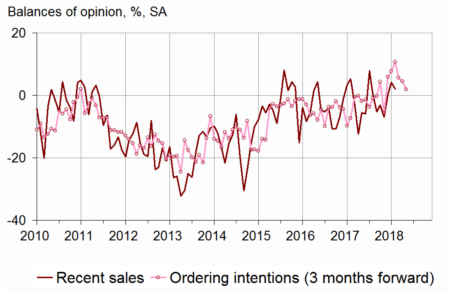
Renewed optimism about employment prospects
The balance on past employment has decreased in retail trade as in motor trade. It has come back to its average in retail trade and remains significantly above it in motor trade. The balance on expected employment has recovered, hitting a ten-year high, mainly because of a sharp rebound in the motor trade sector. In retail trade this balance has advanced again, slightly above its average.
In retail trade, the business climate is stable
In retail trade, the business climate remains favourable. The composite indicator that measures it is stable, at 108. It has stood above its average (100) since May 2017.
The balance concerning recent sales is virtually stable just above its mean level. It has edged down in non-specialised trade and slightly increased in specialised trade.
In retail trade as a whole, fewer managers than last month have anticipated a rise in their orders but nearly as many have expected an increase in their sales. Both corresponding balances stay above their average. Stocks have been deemed practically stable, at their standard level from now on.
More retailers than in January have foreseen increases in prices over the next months. The associated balance has recovered and exceeded its average.
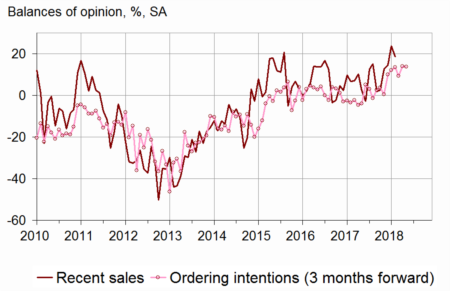
In trade and repair of motor vehicles, the business climate improves again
In trade and repair of motor vehicles and motor cycles, the business climate has gained two points. At 120, it has reached its highest point since the beginning of the survey in this sector (2003), significantly above its average (100).
However, the balance on past sales has declined, as the one on general business outlook. Those about expected sales and ordering intentions are stable. These four balances remain significantly above their mean level.
Stocks have been considered slightly higher, the corresponding balance moving above its average.
The balance on expected prices has increased and has reached a level unseen since September 2008.
graphiqueChart_3 – Recent sales and ordering intentions in trade and repair of motor vehicles
graphiqueChart_4 – Business climate synthetic indicator in retail trade and in trade and repair of motor vehicles
tableauTable_2 – Detailed data
| Ave. (1) | Nov. 17 | Dec. 17 | Jan. 18 | Feb. 18 | |
|---|---|---|---|---|---|
| Retail trade - Global data | |||||
| Business climate | 100 | 110 | 108 | 108 | 108 |
| Gener. busin. outlook | –29 | –2 | 3 | –1 | –2 |
| Recent sales | –6 | –15 | –5 | –4 | –5 |
| Expected sales | 0 | 13 | 6 | 5 | 4 |
| Ordering intentions | –7 | 10 | 7 | –1 | –4 |
| Stocks | 10 | 7 | 7 | 11 | 10 |
| Past selling prices (2) | –8 | –3 | 6 | ||
| Expected selling prices | –5 | –1 | –4 | –7 | 1 |
| Cash position (2) | –13 | –13 | –15 | ||
| Workforce size: recent trend | 2 | 6 | 0 | 4 | 2 |
| Workforce size: future trend | –2 | 0 | –1 | 0 | 1 |
| Non-specialised retail trade | |||||
| Recent sales | –2 | –16 | –3 | 1 | –2 |
| Expected sales | 6 | 31 | 10 | 8 | 9 |
| Ordering intentions | 2 | 26 | 15 | 5 | 3 |
| Stocks | 7 | 6 | 3 | 7 | 6 |
| Past selling prices (2) | –8 | 4 | 18 | ||
| Expected selling prices | –5 | 6 | 0 | –8 | 3 |
| Cash position (2) | –7 | –9 | –9 | ||
| Specialised retail trade | |||||
| Recent sales | –12 | –13 | –8 | –11 | –9 |
| Expected sales | –8 | –7 | 3 | 1 | –2 |
| Ordering intentions | –17 | –8 | –5 | –8 | –12 |
| Stocks | 13 | 7 | 12 | 17 | 15 |
| Past selling prices (2) | –8 | –11 | –8 | ||
| Expected selling prices | –5 | –9 | –9 | –7 | –3 |
| Cash position (2) | –22 | –18 | –22 | ||
| Trade and repair of motor cars and motorcycles | |||||
| Business climate | 100 | 118 | 117 | 118 | 120 |
| Gener. busin. outlook | –27 | 14 | 10 | 16 | 12 |
| Recent sales | –7 | 13 | 15 | 24 | 19 |
| Expected sales | –6 | 20 | 19 | 19 | 19 |
| Ordering intentions | –10 | 13 | 9 | 14 | 14 |
| Stocks | 15 | 15 | 16 | 13 | 17 |
| Past selling prices (2) | 1 | 3 | 2 | ||
| Expected selling prices | 4 | 6 | 3 | 3 | 10 |
| Cash position (2) | –23 | –7 | –14 | ||
| Workforce size: recent trend | –8 | 7 | –1 | 5 | 1 |
| Workforce size: future trend | –6 | 0 | 3 | –5 | 6 |
- (1) Average since 1991 (2003 for trade and repair of motor vehicles and 2004 for recent and expected sales and ordering intentions).
- (2) Bi-monthly question (odd-numbered months).
- Source: INSEE - monthly survey in retail trade and in trade and repair of motor vehicles
Documentation
Methodology (pdf,129 Ko)
Pour en savoir plus
