


 30 January 2018
2018- n° 24Household consumption expenditure on goods was down in November (−1.2%) but almost
stable over the fourth quarter 2017 (−0.1%) Household consumption expenditure on goods - December 2017
30 January 2018
2018- n° 24Household consumption expenditure on goods was down in November (−1.2%) but almost
stable over the fourth quarter 2017 (−0.1%) Household consumption expenditure on goods - December 2017
In December 2017, household expenditure on goods declined in volume* (−1.2%), after a sharp rise in November (+3.0% after −2.1% in October). Food consumption and purchases of durable goods both fell sharply. Over the last quarter 2017, expenditure on goods was virtually stable (−0.1%).
In December 2017, household expenditure on goods declined in volume* (−1.2%), after a sharp rise in November (+3.0% after −2.1% in October). Food consumption and purchases of durable goods both fell sharply. Over the last quarter 2017, expenditure on goods was virtually stable (−0.1%).

*Volumes are measured at chain-link previous year prices (2010 euro billions) and all figures are trading-day and seasonally adjusted.
graphiqueGraph1 – Total consumption of goods
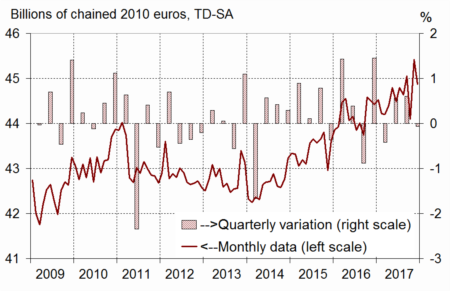
- Source: INSEE
Food products: marked downturn
In December 2017, food consumption diminished (−1.4%), after rising strongly in November (+1.4%). Purchases of processed agrifoods declined, especially expenditure on dairy products, meat products and manufactured goods (canned food, condiments, etc.). Likewise, agricultural good purchases along with beverage and tobacco consumption shrank. Over the quarter, food consumption increased slightly (+0.4%).
graphiqueGraph2 – Food products, engineered goods and energy
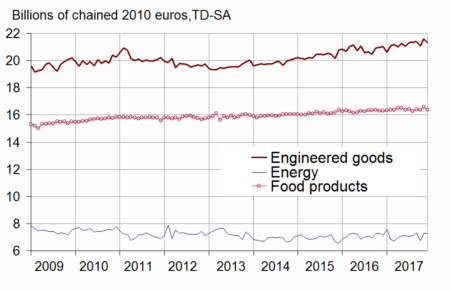
- Source: INSEE
Engineered goods: sharp fall
In December 2017, expenses on engineered goods fell markedly (−1.4% after +2.6% in November). They were almost stable over the quarter (−0.1%).
Durables: pronounced decline
In December, consumption of durables fell strongly (−2.0% after +2.4% in November). Consumption of household durables, in particular audiovisual devices, smartphones and computers suffered the repercussions of November's buoyant spending.
However, transport equipment expenditure recovered significantly in December (+0.9%), driven by new vehicule purchases. Over the quarter, purchases of durables rose slightly (+0.5%)
Textile-clothing: decreasing
In December, expenses on textile-clothing decreased (−1.9%) after a sharp upturn in November (+6.4% after −6.3% in October). In particular, purchases of clothing fell noticeably. Over the quarter, expenditure on textile-clothing declined (−2.1%).
Other engineered goods: almost stable
In December, expenses on “other engineered goods” were virtually stable (+0.1%). Perfume consumption increased while DIY material expenditure declined. Over the whole quarter, expenses on “other engineered goods” were almost stable (+0.1%).
graphiqueGraph3 – Breakdown of engineered goods
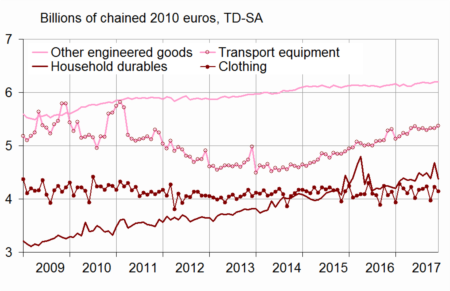
- Source: INSEE
Energy: slight decline
In December 2017, energy consumption decreased slightly (−0.4%) after a strong rebound in November (+8.1% after −7.8% in October). Refined product consumption, in particular motor vehicle fuels, was up again (+3.4% after +4.0% in November), partially offsetting the drop in gas and electricity expenditure. Over the quarter, energy consumption was down (−0.9%).
graphiqueGraph4 – Breakdown of energy
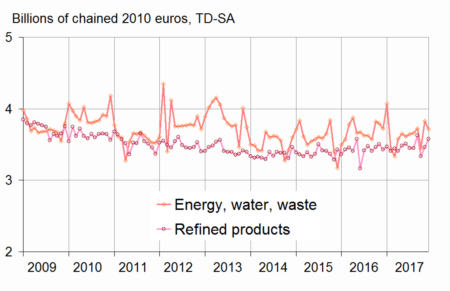
- Source: INSEE
The variation in November 2017 is revised upwards
Compared to the previous estimate, the variation in household expenditure on goods in November 2017 is revised upwards: +3.0% instead of +2.2%.
New information has indeed been integrated, in particular concerning household durables (especially audiovisual equipment and smartphone expenditure). Besides, the seasonal adjustment coefficients have been updated.
tableauTable – Household consumption expenditure on goods
| Weight (1) | Oct. 2017 | Nov. 2017 | Dec. 2017 | Dec. 17 / Dec. 16 | Q4/Q3 | |
|---|---|---|---|---|---|---|
| Food products | 38 | –0.2 | 1.4 | –1.4 | 0.4 | 0.4 |
| - excl. Tobacco | 35 | –0.3 | 1.7 | –1.3 | 1.0 | 0.6 |
| Engineered goods | 44 | –1.5 | 2.6 | –1.4 | 1.3 | –0.1 |
| - Durables | 22 | –0.4 | 2.4 | –2.0 | 2.0 | 0.5 |
| Including : | ||||||
| - Transport equipment | 12 | 0.7 | 0.0 | 0.9 | 1.2 | 0.7 |
| - Household durables | 7 | –2.5 | 6.8 | –6.5 | 3.8 | 0.1 |
| - Textile-clothing | 9 | –6.3 | 6.4 | –1.9 | 0.2 | –2.1 |
| - Other engineered goods | 13 | –0.2 | 0.4 | 0.1 | 0.9 | 0.1 |
| Energy | 18 | –7.8 | 8.1 | –0.4 | 1.7 | –0.9 |
| - Energy, water, waste | 10 | –7.5 | 11.1 | –3.1 | –0.2 | –0.5 |
| - Refined Products | 8 | –8.2 | 4.0 | 3.4 | 4.4 | –1.4 |
| Total | 100 | –2.1 | 3.0 | –1.2 | 1.0 | –0.1 |
| - Including Manufactured goods | 84 | –1.5 | 2.2 | –1.0 | 1.3 | 0.1 |
- (1) Weighting in the consumption expenditure on goods in value in 2016
Documentation
Methodology (pdf,23 Ko)
Pour en savoir plus
