


 30 January 2018
2018- n° 23French GDP increased by 0.6% in Q4 2017 Quarterly national accounts - first estimate - fourth quarter 2017
30 January 2018
2018- n° 23French GDP increased by 0.6% in Q4 2017 Quarterly national accounts - first estimate - fourth quarter 2017
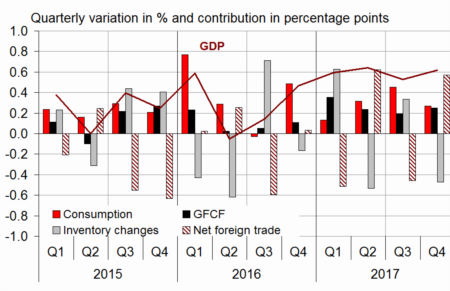
In Q4 2017, GDP in volume terms* increased again: +0.6%, after +0.5% in Q3. On average over the year, GDP accelerated markedly: +1.9% after +1.1% in 2016.
Total gross fixed capital formation (GFCF) accelerated slightly (+1.1% after +0.9%) while household consumption expenditure slowed down (+0.3% after +0.6%). Overall, final domestic demand excluding inventory changes contributed to GDP growth by +0.5 points in Q4 2017 (after +0.6 points).
Foreign trade balance contributed positively to GDP growth (+0.6 points after −0.5 points): exports accelerated markedly (+2.6% after +1.1%) while imports slowed down sharply (+0.7% after +2.4%). Conversely, changes in inventories contributed negatively (−0.5 points after +0.3 points).

Edited version on 1 February 2018: the contribution of foreign trade on GDP growth in 2017 was −0.3 points (instead of −0.4 as published on 30 January 2018).
In Q4 2017, GDP in volume terms* increased again: +0.6%, after +0.5% in Q3. On average over the year, GDP accelerated markedly: +1.9% after +1.1% in 2016.
Total gross fixed capital formation (GFCF) accelerated slightly (+1.1% after +0.9%) while household consumption expenditure slowed down (+0.3% after +0.6%). Overall, final domestic demand excluding inventory changes contributed to GDP growth by +0.5 points in Q4 2017 (after +0.6 points).
Foreign trade balance contributed positively to GDP growth (+0.6 points after −0.5 points): exports accelerated markedly (+2.6% after +1.1%) while imports slowed down sharply (+0.7% after +2.4%). Conversely, changes in inventories contributed negatively (−0.5 points after +0.3 points).
*This growth rate is seasonally and working-day adjusted; volumes are chain-linked previous-year-prices volumes.
graphiqueGraph – GDP and its main components
- Source: INSEE
tableauTab1 – GDP and its main components: chain-linked volumes
| 2017 Q1 | 2017 Q2 | 2017 Q3 | 2017 Q4 | 2016 | 2017 | |
|---|---|---|---|---|---|---|
| GDP | 0.6 | 0.6 | 0.5 | 0.6 | 1.1 | 1.9 |
| Imports | 1.0 | 0.0 | 2.4 | 0.7 | 4.2 | 4.3 |
| Household consumption *expenditure | 0.1 | 0.4 | 0.6 | 0.3 | 2.1 | 1.3 |
| General government's *consumption expenditure | 0.3 | 0.5 | 0.6 | 0.4 | 1.2 | 1.5 |
| GFCF | 1.6 | 1.1 | 0.9 | 1.1 | 2.7 | 3.7 |
| *of which Non-financial corporated and unincorporated enterprises | 2.3 | 1.2 | 1.1 | 1.5 | 3.4 | 4.3 |
| Households | 1.6 | 1.3 | 1.0 | 0.7 | 2.4 | 5.1 |
| General government | -0.6 | 0.3 | -0.2 | 0.3 | -0.1 | -0.8 |
| Exports | -0.7 | 2.2 | 1.1 | 2.6 | 1.9 | 3.5 |
| Contributions: | ||||||
| Internal demand excluding inventory changes | 0.5 | 0.6 | 0.6 | 0.5 | 2.0 | 1.9 |
| Inventory changes | 0.6 | -0.5 | 0.3 | -0.5 | -0.1 | 0.4 |
| Net foreign trade | -0.5 | 0.6 | -0.5 | 0.6 | -0.8 | -0.3 |
- Source: INSEE
Total production kept on increasing
In Q4 2017, total production accelerated slightly in Q4 (+0.8% after +0.7%), mainly due to manufactury industry (+1.5% after +0.8%). In contrast, energy production weakened a little. In services, production rose overall again (+0.7% after +0.6%).
On average over the year, total production sped up (+2.3% after +0.9%), in particular in manufacturing industry (+2.0% after +0.8%) and in construction. Agricultural production also recovered (+2.3% after −5.6%), after the adverse weather conditions in 2016.
tableauTab2 – Production, consumption and GFCF: main components
| 2016 Q1 | 2017 Q2 | 2017 Q3 | 2017 Q4 | 2016 | 2017 | |
|---|---|---|---|---|---|---|
| Production of branches | 0.7 | 0.8 | 0.7 | 0.8 | 0.9 | 2.3 |
| Goods | 0.1 | 0.8 | 0.9 | 1.2 | 0.2 | 1.9 |
| Manufactured Industry | 0.2 | 0.8 | 0.8 | 1.5 | 0.8 | 2.0 |
| Construction | 0.6 | 1.1 | 0.3 | 0.3 | 0.1 | 2.4 |
| Market services | 1.0 | 0.9 | 0.7 | 0.9 | 1.4 | 2.8 |
| Non-market services | 0.3 | 0.4 | 0.5 | 0.4 | 1.0 | 1.3 |
| Household consumption | 0.1 | 0.4 | 0.6 | 0.3 | 2.1 | 1.3 |
| Food products | 0.3 | 0.6 | -0.5 | 0.4 | 0.9 | 0.8 |
| Energy | -2.8 | 0.3 | 1.5 | -0.9 | 2.1 | -0.1 |
| Engineered goods | -0.1 | 0.6 | 1.2 | -0.1 | 2.4 | 1.7 |
| Services | 0.6 | 0.3 | 0.6 | 0.6 | 1.6 | 1.8 |
| GFCF | 1.6 | 1.1 | 0.9 | 1.1 | 2.7 | 3.7 |
| Manufactured goods | 1.9 | 0.6 | 1.3 | 1.9 | 6.1 | 2.1 |
| Construction | 0.6 | 1.1 | 0.5 | 0.4 | 0.2 | 2.5 |
| Market services | 2.7 | 1.3 | 1.0 | 1.5 | 3.9 | 6.2 |
- Source: INSEE
Household consumption slowed down
In Q4 2017, household consumption slowed down (+0.3% after +0.6%). Consumption of services grew at the same pace as in the previous quarter (+0.6%), while expenditure in goods declined slightly (−0.1% after +0.6% in Q2 and Q3).
Energy consumption declined (−0.9% after +1.5%), mainly because of temperatures lower than the seasonal norms in Q3. Expenditure on engineered goods slowed down (−0.1% after +1.2%), notably because of a sharp slowdown in equipment goods and a downturn in other industrial goods.
On average over the year, household consumption slowed down in 2017 (+1.3% after +2.1%), mainly because of a marked slowdown in goods.
tableauTab3 – Sectoral accounts
| 2017 Q1 | 2017 Q2 | 2017 Q3 | 2017 Q4 | 2016 | 2017 (ovhg) | |
|---|---|---|---|---|---|---|
| Profit ratio of NFCs* (level) | 31.6 | 31.8 | 31.7 | 31.8 | ||
| Households' purchasing power | 0.2 | 0.8 | 0.5 | 1.8 | 1.6 |
- *NFCs: non-financial corporations
- Source: INSEE
tableauTab4 – Households' disposable income and ratios of households' account
| 2017 Q1 | 2017 Q2 | 2017 Q3 | 2017 Q4 | 2016 | 2017 (ovhg) | |
|---|---|---|---|---|---|---|
| HDI | 0.7 | 0.6 | 0.6 | 1.7 | 2.4 | |
| Household purchasing power | 0.2 | 0.8 | 0.5 | 1.8 | 1.6 | |
| HDI by cu* (purchasing power) | 0.1 | 0.6 | 0.4 | 1.4 | 1.2 | |
| Adjusted HDI (purchasing power) | 0.2 | 0.7 | 0.5 | 1.7 | 1.6 | |
| Saving rate (level) | 14.1 | 14.4 | 14.3 | 14.0 | ||
| Financial saving rate (level) | 4.5 | 4.7 | 4.6 | 4.7 |
- *cu: consumption unit
- Source: INSEE
Corporate investment accelerated
Total GFCF accelerated in Q4 2017 (+1.1% after +0.9%). Investment in construction rose again (+0.4% after +0.5%); it remained dynamic in the building sector but decreased in public works. GFCF in manufactured goods sharply accelerated (+1.9% after +1.3%), particularly in transport equipment. Investment in tradable services also remained dynamic (+1.5% after +1.0%), notably in the information-communication sector (softwares publishing).
All in all, non-financial corporations investment accelerated over the past quarter (+1.5% after +1.1%), while household investment slowed down a little (+0.7% after +1.0%).
Over the year 2017, total GFCF accelerated sharply: +3.7% after +2.7%.
tableauTab5 – Ratios of non-financial corporations' account
| 2017 Q1 | 2017 Q2 | 2017 Q3 | 2017 Q4 | 2016 | |
|---|---|---|---|---|---|
| Profit share | 31.6 | 31.8 | 31.7 | 31.8 | |
| Investment ratio | 23.7 | 23.7 | 23.8 | 23.3 | |
| Savings ratio | 19.7 | 19.8 | 20.0 | 19.7 | |
| Self-financing ratio | 83.2 | 83.4 | 83.8 | 84.3 |
- Source: INSEE
Foreign trade balance contributed positively to GDP growth
In Q4 2017, exports accelerated (+2.6% after +1.1%), because of sales of transport equipment. At the same time, imports significantly decelerated (+0.7% after +2.4%), mainly because of a sharp decline in transport equipment. All in all, foreign trade balance contributed to GDP growth by +0.6 points (after −0.5 points).
On average over the year, exports considerably accelerated (+3.5% after +1.9% in 2016) while imports progressed virtually at the same pace than in 2016 (+4.3% after +4.2%). As a consequence, the weight of foreign trade balance on GDP growth was lesser in 2017 than in 2016 (−0.3 points after −0.8 points).
Changes in inventories weighed on GDP growth
In Q4 2017, changes in inventories contributed negatively to GDP growth (−0.5 points after +0.3 points). This decrease is mainly due to transport equipment (notably aeronautics).
On average over the year, the contribution of changes in inventories to the activity stood at +0.4 points (after −0.1 points).
tableauTab6 – Expenditure. receipts and net borrowing of public administrations
| 2017 Q1 | 2017 Q2 | 2017 Q3 | 2017 Q4 | 2016 | |
|---|---|---|---|---|---|
| In billions of euros | |||||
| Total expenditure | 316.9 | 318.0 | 321.4 | 1256.9 | |
| Total receipts | 299.9 | 303.4 | 304.9 | 1181.1 | |
| Net lending (+) or borrowing (−) | −17.0 | −14.6 | −16.5 | −75.8 | |
| In % of GDP | |||||
| Net lending (+) or borrowing (−) | −3.0 | −2.6 | −2.9 | −3.4 |
- Source: INSEE
Pour en savoir plus
