


 20 December 2017
2017- n° 334In November, oil prices kept rising Prices of oil and raw material imports - November 2017
20 December 2017
2017- n° 334In November, oil prices kept rising Prices of oil and raw material imports - November 2017
In November 2017, the price of crude oil in euros increased again (+9.0% during the month, after +5.2%). The prices in euros of all other imported commodities increased too (+1.0% after −1.1%). The prices of industrial raw materials bounced back (+2.0% after −1.4%) and those of raw food materials were virtually stable (+0.1% after −0.9%).

Warning: the imported raw materials index has been upgraded. The basket of goods has been expanded, weights re-estimated, and the index has been rebased in 2010. All the results in this publication (october data and previous months) are computed with respect to the new index and can be different from previous publications. For further details, please refer to the methodology note.
In November 2017, the price of crude oil in euros increased again (+9.0% during the month, after +5.2%). The prices in euros of all other imported commodities increased too (+1.0% after −1.1%). The prices of industrial raw materials bounced back (+2.0% after −1.4%) and those of raw food materials were virtually stable (+0.1% after −0.9%).
Oil price increased again
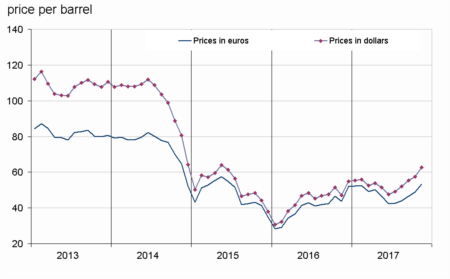
In November 2017, the price of North Sea crude oil (Brent) in euros kept rising (+9.0% after +5.2% in August) to an average of €53 per barrel. In dollars, the rise was comparable (+8.9% after +3.8%), because the exchange rate reminded stable.
graphiqueGraph1 – Oil (Brent)
- Source: INSEE
tableauTable1 – Oil and petroleum products
| Prices | Change (%) | |||
|---|---|---|---|---|
| of last month | over the last month | over the last 3 months | over the last 12 months | |
| Brent in $ per barrel | 62.7 | 8.9 | 20.8 | 33.1 |
| Brent in € per barrel | 53.4 | 9.0 | 21.5 | 22.4 |
| Gasoline €/L | 0.4 | 6.8 | 9.1 | 15.3 |
| Gas Oil | 477.2 | 5.2 | 16.9 | 20.6 |
| Heavy fuel | 322.8 | 9.2 | 17.8 | 22.2 |
| Naphtha | 487.6 | 11.8 | 25.6 | 26.8 |
- Prices are in euros per tonne unless otherwise specified
- Source: INSEE
Industrial commodity prices bounced back
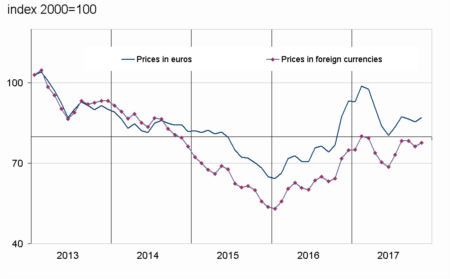
In November 2017, the prices in euros of industrial raw materials bounced back (+2.0% after −1.4%). The prices of minerals recovered (+1.3% after −2.4%), largely because of the rebound in ferrous metals prices (+4.1% after −12.4%). The prices of precious metals picked up too (+0.9% after −1.1%). However, the prices of non-ferrous metals fell back (−0.2% after +3.7%), due to the fall in aluminium prices under the threat of United States setting up import taxes on chinese aluminium. The prices of agro-industrial raw materials sped up (+5.0% after +3.5%). Indeed, the price of natural wood pulp kept increasing (+4.5% after +3.3%) as was the price of sawn softwood (+9.3% after +9.2%). The price of hides accelerated (+0.9% after +0.7%) and the price of tropical wood eased (+0.3% after +0.5%). The price of natural fibres bounced back (+3.4% after −1.1%), driven by the rebound in cotton price. However, the price of natural rubber decreased again (−1.7% after −8.1%).
Food commodity prices were almost unchanged
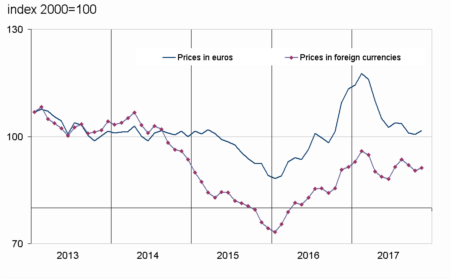
In euros, the prices of raw food materials were virtually stable (+0.1% after −0.9%). The price of all meats bounced back (−5.2% after −2.6%), because of the price of pork (+29.6% after −16.9%). The price of sugar accelerated (+5.4% after +3.6%). The prices of oil seeds and vegetable oils eased a bit (+0.7% after +1.0%) as those of cereals (+0.1% after +0.2%). However, the prices of seafood products decreased again (−3.3% after −2.9%) and those of tropical foodstuffs edged down (−1.7% after +0.7%) because of Robusta high crops expectations.
graphiqueGraph3 – Food
- Source: INSEE
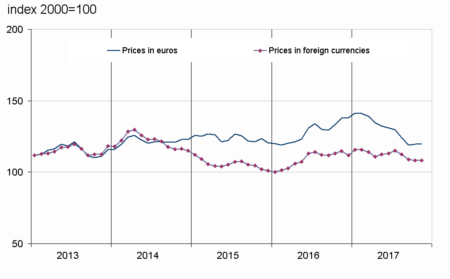
graphiqueGraph2 – Imported raw materials (excluding energy)
- Source: INSEE
graphiqueGraph4 – Industrial raw materials
- Source: INSEE
tableauTable2 – Imported raw materials (excluding energy) in euros
| Index | Changes (%) | |||
|---|---|---|---|---|
| of last month | over the last month | over the last 3 months | over the last 12 months | |
| Food total | 119.7 | 0.1 | –3.5 | –13.3 |
| Tropical foodstuffs | 97.7 | –1.7 | –3.3 | –22.6 |
| Oil seeds, vegetable oils | 112.7 | 0.7 | 2.3 | –6.9 |
| Cereals | 90.2 | 0.1 | 0.5 | –2.8 |
| Sugar | 76.1 | 5.4 | 9.2 | –34.0 |
| Meat | 143.3 | 5.2 | –8.7 | 1.3 |
| Seafood products | 120.1 | –3.3 | –5.9 | –19.2 |
| Industrial raw materials | 87.1 | 2.0 | –0.3 | –0.3 |
| Agricultural raw materials | 115.9 | 5.0 | 9.9 | 8.3 |
| Natural Fibres | 94.0 | 3.4 | 3.0 | –2.7 |
| Natural rubber | 47.8 | –1.7 | –6.7 | –21.8 |
| Hides | 77.6 | 0.9 | –0.3 | –27.1 |
| Wood pulp | 116.1 | 4.5 | 7.9 | 9.2 |
| Tropical wood | 95.8 | 0.3 | 2.6 | –2.1 |
| Sawn softwood | 215.7 | 9.3 | 23.8 | 46.6 |
| Minerals | 81.4 | 1.3 | –2.6 | –2.0 |
| Ferrous metals | 51.3 | 4.1 | –14.9 | –18.4 |
| Non-ferrous metals | 107.1 | –0.2 | 5.5 | 11.2 |
| Precious metals | 107.9 | 0.9 | 1.4 | –4.2 |
| All commodities | 101.6 | 1.0 | –2.0 | –7.3 |
- Source: INSEE
Pour en savoir plus
Time series : Raw materials prices
