


 30 November 2017
2017- n° 322In October 2017, agricultural prices slowed again (+0.3% over one year) Indices of agricultural prices - October 2017
30 November 2017
2017- n° 322In October 2017, agricultural prices slowed again (+0.3% over one year) Indices of agricultural prices - October 2017
In October 2017, agricultural products prices slowed down again : +0.3% over one year, after +0.8% in september and +1.7% in August. Excluding fruits and vegetables, they accelerated sharply (+0.9% over one year and +1.6% over one month).
In October 2017, agricultural products prices slowed down again : +0.3% over one year, after +0.8% in september and +1.7% in August. Excluding fruits and vegetables, they accelerated sharply (+0.9% over one year and +1.6% over one month).
Moderate increase for soft wheat, decline for grain maize and oilseeds
In October 2017, overall cereal prices did not change much (−0.2% over one month). Soft wheat prices went up slightly (+0.4%) after two months of decrease (−0.5% in September and −5.8% in August). The abundance of Russian supply is still weighing on prices but global demand remains dynamic. Grain maize prices fell by 2.1% in one month as crop yields have been better than expected in the United States and France. Oilseed prices dropped again (−0.7% over one month and over one year −9.0%). The prices of rapeseed were almost unchanged (−0.1%), supported by the decline of the euro against the dollar.
graphiqueGraph1 – Producer prices of cereals
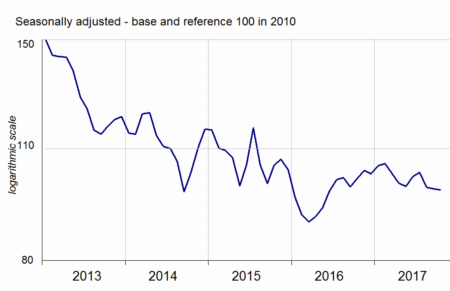
- Source: INSEE
Vegetables prices lost more than 11%
In October 2017, fresh vegetables prices fell by 11.4% over a year. It concerned especially salads (−13.4%) and endives (−13.8%) for which supply grew up while demand was sluggish. Fresh fruit Prices rose by 3.1% over a year. The rise is more pronounced for pears (+7.0%) and grapes (+18.1%) than for apples (+ 2.1%).
graphiqueGraph2 – Producer prices of fresh vegetables
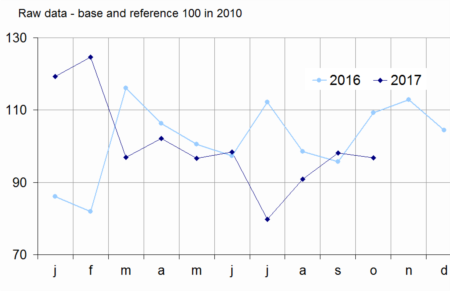
- Source: SSP (ministry in charge of agriculture)
Increase of animal prices
Animal prices bounced back in October (+1.1% over one month after −0.6% in September). Pork prices are stable while cattle prices went up by 1.7%. Climatic conditions in October kept cattle herds in the meadows, limiting the supply to slaughterhouses. Over a year, cattle prices rose 8.6% whereas pigs prices declined by 11,0% and fell back to spring 2016 levels.
graphiqueGraph3 – Producer prices of pigs and large cattle
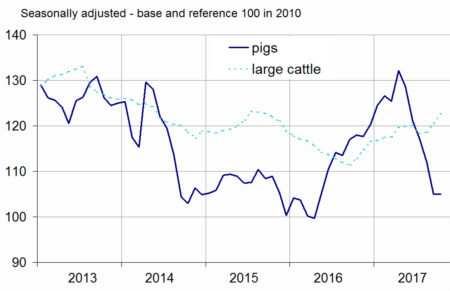
- Source: INSEE
Egg prices soared again
Eggs of French origin are still very much in demand, as the Fipronil crisis has reduced eggs availability in Europe. Their prices increased by 34.7% over one month (+62.9% over one year). The price of cow's milk benefited from the strong demand for butter: it gained 18.4% over one year in September.
tableautable1 – Index of producer prices of agricultural products (IPPAP)
| Variation as % over | |||||
|---|---|---|---|---|---|
| Weights | Oct 2017 | a month | 3 months | a year | |
| Agricultural goods output | 1000 | 116.2 | /// | /// | +0.3 |
| excluding fruits and vegetables | 900 | 116.8 | +1.6 | –0.6 | +0.9 |
| Crop output (excluding fruits and vegetables) | 505 | 116.8 | +1.0 | –3.4 | –4.2 |
| Cereals | 188 | 97.8 | –0.2 | –4.9 | –3.4 |
| of which soft wheat | 112 | 95.1 | +0.4 | –5.9 | –3.4 |
| grain maize | 41 | 90.1 | –2.1 | –5.1 | –8.3 |
| Potatoes | 26 | 169.5 | /// | /// | –30.5 |
| Wines | 177 | 137.9 | +2.1 | +2.5 | +1.8 |
| protected designation of origin | 84 | 154.1 | +2.5 | +4.8 | +4.7 |
| other wines | 23 | 132.3 | +5.3 | –1.2 | –6.2 |
| Oleaginous | 49 | 94.2 | –0.7 | –2.4 | –9.0 |
| Horticultural products | 30 | 111.3 | +1.6 | +0.9 | +0.5 |
| Other crop products | 36 | 110.1 | –0.3 | –0.9 | +0.8 |
| Fruits and vegetables (1) | 100 | 110.6 | /// | /// | –4.2 |
| Fresh vegetables | 53 | 96.8 | /// | /// | –11.4 |
| Fresh fruits | 35 | 131.1 | /// | /// | +3.1 |
| Animal output | 395 | 116.7 | +2.4 | +3.1 | +8.1 |
| Animals | 234 | 113.6 | +1.1 | –0.6 | +1.1 |
| of which large cattle | 96 | 122.6 | +1.7 | +3.6 | +8.6 |
| calves | 26 | 105.5 | +3.0 | +6.7 | +2.2 |
| pigs | 54 | 105.0 | 0.0 | –10.5 | –11.0 |
| sheep | 10 | 117.2 | –0.9 | –7.0 | –1.4 |
| poultry | 46 | 108.9 | –0.1 | –0.2 | –0.2 |
| of which chicken | 28 | 108.8 | –0.2 | –0.3 | +0.1 |
| Milk | 147 | 112.4 | /// | +1.5 | +13.5 |
| of which cow milk (2) | 137 | 112.1 | /// | +1.4 | +14.3 |
| Eggs | 15 | 209.8 | +34.7 | +74.3 | +62.9 |
- * cf. methodological note
- /// Absence of meaning due to the nature of these series
- (1) Including vegetables for industry.
- (2) The September value of cow milk price index has been carried forward in October. The previous month variation is the one commented in the text : +18.4% over one year in September 2017
- Sources: INSEE, SSP (ministry in charge of agriculture)
Purchase prices of means of production went up slightly over a month
Intermediate consumption prices slowed down (+0.2% in October after +0.5% in September). They rose 0.9% over one year (after + 1.1%). Energy prices (+1.6% over one month) and fertilisers and soil improvers prices (+2.1% over one month) increased again while animal feed prices kept declining (−0.7%). Capital goods prices went up 0.5% over one month and increased by 2.3% over a year.
Revision
The variation over one year of IPPAP has been rosen by 0.2 points in September to +0.8%; that of IPAMPA has not changed at +1.3%.
graphiqueGraph4 – Purchase prices of the means of agricultural production
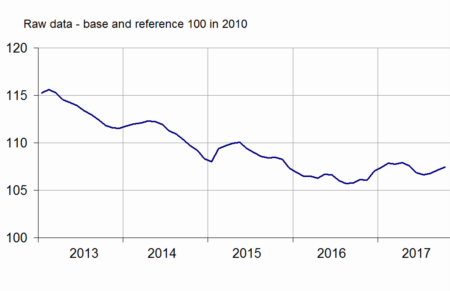
- Sources: INSEE, SSP (ministry in charge of agriculture)
tableautable2 – Indices of purchase prices of the means of agricultural production (IPAMPA)
| Variation as % over | |||||
|---|---|---|---|---|---|
| Weights | Oct 2017 | a month | 3 months | a year | |
| Total input | 1000 | 107.4 | +0.2 | +0.8 | +1.2 |
| Intermediate consumptions | 764 | 106.6 | +0.2 | +0.9 | +0.9 |
| Energy | 100 | 101.4 | +1.6 | +6.8 | +5.4 |
| Seeds | 57 | 106.1 | –0.3 | +0.2 | –1.2 |
| Fertilisers and soil improvers | 92 | 100.7 | +2.1 | +3.6 | +3.2 |
| Plant protection products | 78 | 98.1 | 0.0 | +0.4 | –1.1 |
| Animal feed | 205 | 111.3 | –0.7 | –1.5 | –0.6 |
| Veterinary expenses | 43 | 120.4 | +0.2 | +0.7 | +1.4 |
| Small equipment and tools | 17 | 106.7 | –0.7 | –1.0 | –1.9 |
| Maintenance of materials | 67 | 116.0 | –0.1 | +0.3 | +2.0 |
| Maintenance of buildings | 9 | 109.2 | 0.0 | +0.3 | +1.9 |
| Other goods and services | 97 | 102.1 | +0.1 | –0.1 | –0.1 |
| Goods and services contributing to investment | 236 | 110.0 | +0.5 | +0.5 | +2.3 |
| Material | 186 | 111.1 | +0.5 | +0.6 | +1.9 |
| Tractors | 79 | 113.9 | +1.0 | +1.3 | +4.1 |
| Machinery and equipment for cultivation | 36 | 112.0 | +0.2 | +0.4 | +1.5 |
| Machinery and equipment for harvesting | 42 | 109.6 | +0.3 | +0.3 | –0.2 |
| Utility vehicles | 18 | 103.6 | –0.8 | –1.1 | –1.0 |
| Buildings | 50 | 105.8 | 0.0 | –0.1 | +3.6 |
- (1) The repayment of the domestic tax on energy product (TICPE) benefiting farmers has been applied in advance for the year 2017.
- Sources: INSEE, SSP (ministry in charge of agriculture)
Documentation
Methodology (pdf,122 Ko)
Pour en savoir plus
Time series : Indices of agricultural prices
