


 29 November 2017
2017- n° 312Household consumption expenditure on goods fell sharply in October (−1.9%) Household consumption expenditure on goods - October 2017
29 November 2017
2017- n° 312Household consumption expenditure on goods fell sharply in October (−1.9%) Household consumption expenditure on goods - October 2017
In October 2017, household consumption expenditure on goods was down by 1.9% in volume* (after +1.0%), particularly due to energy and engineered goods.
In October 2017, household consumption expenditure on goods was down by 1.9% in volume* (after +1.0%), particularly due to energy and engineered goods.

*Volumes are measured at chain-link previous year prices (2010 euro billions) and all figures are trading-day and seasonally adjusted.
graphiqueGraph1 – Total consumption of goods
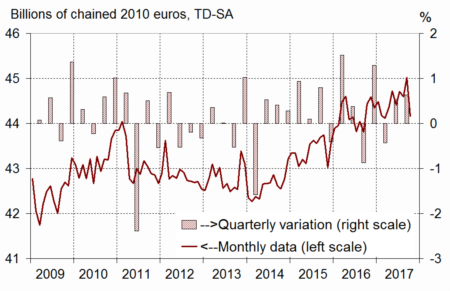
- Source: INSEE
Energy: sharp fall
In October 2017, energy consumption diminished (−6.1% after +3.3% in September). On the one hand, expenses on gas and electricity shrank, as a result of higher temperatures than the seasonal norm. On the other hand, consumption of refined products, especially gasoline and diesel, dropped after rising sharply in September (−8.0% after +5.3%).
graphiqueGraph2 – Breakdown of energy
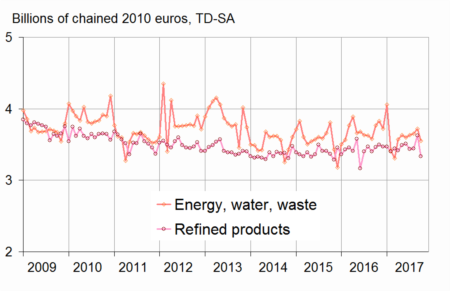
- Source: INSEE
Engineered goods: pronounced downturn
In October 2017, purchases of engineered goods contracted (−1.7%), after a three-month rise. In particular, spending on household durables and textile-clothing diminished substantially.
Durables: strong fall
In October, purchases of durables were down (−1.1%) after growing slightly for five consecutive months. Expenditure on household durables other than cars contracted sharply (−3.0% after +1.4%), especially on audiovisual equipment, despite the upswing in communication equipment (smartphones).
Furthermore, purchases of transport equipments declined again (−0.3% after −0.2%). In particular, motorhome and caravan purchases experienced a downturn.
Textile-clothing: sharp fall
In October, expenses on textile-clothing fell sharply (−5.2%), after a three-month rise. In particular, footwear purchases decreased strongly.
Other engineered goods: almost stable
In October, expenditure on “other engineered goods” was almost unchanged (−0.1% after −0.3% in September). Consumption of personal care and perfume products decreased again.
graphiqueGraph3 – Breakdown of engineered goods
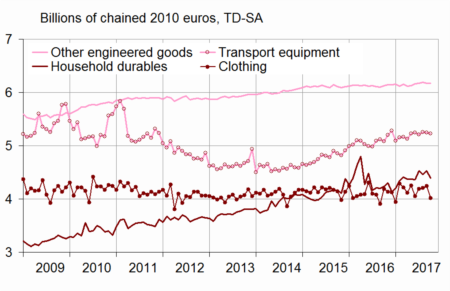
- Source: INSEE
Food products: moderate decline
In October 2017, purchases of food products diminished (−0.3%), after a steep rebound in September (+0.8%). The consumption of unprocessed agricultural goods (fruits and vegetables) fell markedly, while spending on agrifood products was stable. Tobacco consumption increased again after a three-month decline.
graphiqueGraph4 – Food products, engineered goods and energy
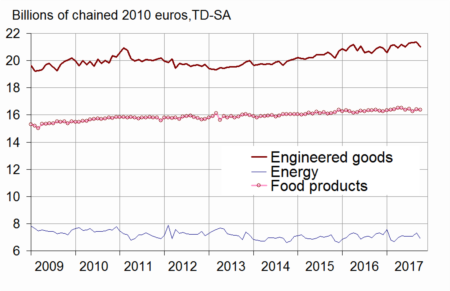
- Source: INSEE
The variation in September 2017 is slightly revised upwards
Compared to the previous estimate, the variation in household expenditure on goods in September 2017 is slightly revised upwards: +1.0% instead of +0.9%. Since the previous publication, new information has been integrated and the seasonal adjustment coefficients have been updated.
tableauTable – Household consumption expenditure on goods
| Weight (1) | Aug. 2017 | Sep. 2017 | Oct. 2017 | Oct. 17 / Oct. 16 | Q / Q-1 (2) | |
|---|---|---|---|---|---|---|
| Food products | 38 | –1.1 | 0.8 | –0.3 | –0.1 | –0.6 |
| - excl. Tobacco | 35 | –1.2 | 0.9 | –0.4 | 0.0 | –0.6 |
| Engineered goods | 45 | 0.2 | 0.2 | –1.7 | 0.7 | 0.4 |
| - Durables | 22 | 0.0 | 0.4 | –1.1 | 2.7 | 0.6 |
| Including : | ||||||
| - Transport equipment | 12 | 0.9 | –0.2 | –0.3 | 2.8 | 0.3 |
| - Household durables | 7 | –1.5 | 1.4 | –3.0 | 3.6 | 0.8 |
| - Textile-clothing | 9 | 0.4 | 0.7 | –5.2 | –4.1 | –0.2 |
| - Other engineered goods | 13 | 0.3 | –0.3 | –0.1 | 0.7 | 0.4 |
| Energy | 17 | 0.4 | 3.3 | –6.1 | –4.9 | 0.2 |
| - Energy, water, waste | 10 | 0.5 | 1.9 | –4.6 | –5.8 | 0.5 |
| - Refined Products | 7 | 0.3 | 5.3 | –8.0 | –3.7 | –0.2 |
| Total | 100 | –0.3 | 1.0 | –1.9 | –0.6 | 0.0 |
| - Including Manufactured goods | 84 | –0.3 | 0.9 | –1.6 | 0.2 | 0.0 |
- (1) Weighting in the consumption expenditure on goods in value in 2016
- (2) Last three months / previous three months
Documentation
Methodology (pdf,23 Ko)
Pour en savoir plus
