


 12 October 2017
2017- n° 270In September 2017, consumer prices fell back by 0.2% over a month and rose by 1.0%
year on year Consumer price index - final results - September 2017
12 October 2017
2017- n° 270In September 2017, consumer prices fell back by 0.2% over a month and rose by 1.0%
year on year Consumer price index - final results - September 2017
In September 2017, the Consumer Prices Index (CPI) edged down by 0.2% over a month, after a rebound of 0.5% in August. This drop mainly came from a seasonal downturn in services prices and, in a lesser extent, from a slight drop in food prices. Energy prices slowed down a little. Contrariwise, manufactured product prices accelerated.
Monthly change: −0.2%; Year-on-year change: +1.0%
In September 2017, the Consumer Prices Index (CPI) edged down by 0.2% over a month, after a rebound of 0.5% in August. This drop mainly came from a seasonal downturn in services prices and, in a lesser extent, from a slight drop in food prices. Energy prices slowed down a little. Contrariwise, manufactured product prices accelerated.
Seasonally adjusted, consumer prices accelerated by 0.2%, as in August.
Year on year, consumer prices gathered pace for the second consecutive month: +1.0% after +0.9% in August and +0.7% in July. This rise resulted from an acceleration in energy prices and food prices and a lesser drop in manufactured product prices. On the other hand, services prices slowed down again, due to a stronger fall in airfares and in communication services.
Stability in core inflation over a year
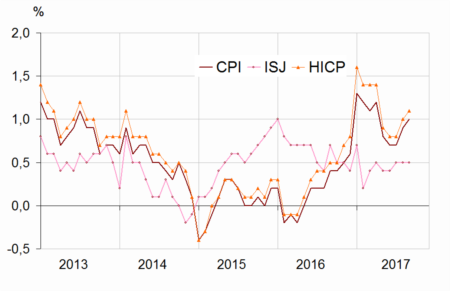
In September 2017, the core inflation indicator (ISJ) rose slightly (+0.1%), after two months of stability. Over a year, it rose by 0.5%, as in July and in August. The Harmonised Index of Consumer Prices (HICP) edged down by 0.2% after a rebound of +0.6% in the previous month; year on year it gathered pace slightly to +1.1% after +1.0% in August.
New year-on-year increase in energy prices
Energy prices slowed down slightly in September (+1.1% after +1.2% in August), but the dynamic was more sustained than in September 2016 (+0.8%). Year on year, energy prices accelerated again (+5.1% after +4.8%). This increase came from the monthly acceleration in prices of petroleum products after a rebound in the previous month (+2.1% after +1.6%). The monthly stability in the prices of natural gas and town gas and electricy partially moderated the sharp rise in petroleum product prices.
tableauTable1 – Detailed figures for various groups
| Items | Weight | Index | Percentage change | |
|---|---|---|---|---|
| 2017 | Sept. 2017 | m-on-m change | y-on-y change | |
| a) All households | ||||
| Overall | 10000 | 101.33 | −0.2 | 1.0 |
| Overall SA* | 10000 | 101.33 | 0.2 | 1.0 |
| Food | 1627 | 101.60 | −0.1 | 1.1 |
| Fresh food | 235 | 105.33 | −0.2 | 1.6 |
| Other food | 1392 | 101.01 | 0.0 | 1.0 |
| Tobacco | 188 | 102.54 | 0.0 | 2.4 |
| Manufactured products | 2617 | 99.53 | 1.5 | −0.5 |
| Clothing and footwear | 433 | 103.46 | 8.6 | −0.7 |
| Medical products | 433 | 94.75 | 0.1 | −1.9 |
| Other manufactured products | 1751 | 99.81 | 0.3 | 0.0 |
| Energy | 748 | 102.23 | 1.1 | 5.1 |
| Petroleum products | 378 | 102.96 | 2.1 | 8.3 |
| Services | 4820 | 102.05 | −1.3 | 1.0 |
| Actual rentals and services for dwellings | 779 | 101.07 | 0.0 | 0.4 |
| Health services | 600 | 101.76 | 0.2 | 1.8 |
| Transport | 282 | 98.66 | −8.1 | 1.7 |
| Communication | 242 | 98.03 | 0.5 | −5.2 |
| Other services | 2917 | 103.03 | −1.3 | 1.5 |
| Total except rents and tobacco | 9183 | 101.36 | −0.2 | 1.0 |
| Total except tobacco | 9812 | 101.30 | −0.2 | 0.9 |
| b) Urban working-class households or households of employees | ||||
| All products excluding tobacco | 9710 | 101.21 | 0.1 | 0.9 |
| c) Households that belong to the lowest equivalized disposable income quintile - France | ||||
| All products excluding tobacco | 9705 | 100.96 | 0.0 | 0.8 |
- *: seasonally adjusted
- Geographical coverage: France excluding Mayotte
- Source: INSEE - Consumer Price Indices
Clear acceleration in food prices year on year
In September 2017, food prices rose sharply faster than in the previous month year on year (+1.1% after +0.6%). This acceleration resulted from a marked rebound in fresh food prices (+1.6% year on year after −0.8%), due to an acceleration in fruit prices (+4.7% after +2.6%) and a lesser drop in vegetables prices (−0.3% after −4.6%). Excluding fresh products, food prices grew more than in August: +1.0% year on year after +0.8%, due to a increase in prices of oils and fats (+4.3% year on year after +3.4%). The increase in food prices excluding fresh food products has been the strongest since August 2013.
Lesser fall in manufactured products
Year on year, manufactured products prices dropped less in September than in August (−0.5% after −0,7%). This lesser fall came from those in clothing and footwear prices (−0.7% year on year after −1.3%), with a later end of summer sales this year. The year-on-year drop in medical health product prices decreased again a little, to −1.9 % after −2.0%. Over a month, their prices rose by 0.1%, first increase since May 2013. The prices of “other manufactured products” were stable year on year after a slight drop (−0.1%) in August. Over a month, they rose by 0.3% as in the previous month. The monthly rebound in prices of audio-visual, photographic and information processing equipment (+0.4%; −1.6% year on year) was offset by a slowdown in furniture and furnishings (+1.4%; +0.4% year on year) and in household appliances (+0.1%; −1.7% year on year).
Slowdown in services prices year on year
Year on year, services prices slowed down in September (+1.0% after +1.2%). This change was mainly due to airfares (+2.5% after +4.3% year o year); from August to September, their prices slumped drastically (−19.6%) with the end of summer holidays. In communication services, the year-on-year drop was accentuated (−5.2% after −4.8%). Contrariwise, the prices of accommodation services accelerated sharply year on year (+4.1% after +2.8%), the drop in prices from August to September being less pronounced this year. Health services prices gathered pace to +1.8% year on year after +1.7% in August, following the changes in medical fees provided by the medical convention signed in August 2016.
graphiqueGraph1 – Consumer Price Index (CPI), core inflation (ISJ)* and Harmonised Index of Consumer Prices (HICP)** year-on-year changes
tableauTable2 – Detailed figures for Core inflation* and HICP**
| Items | Weight | Index | Percentage change | |
|---|---|---|---|---|
| 2017 | Sept. 2017 | m-on-m change | y-on-y change | |
| Core inflation - All items | 6134 | 101.22 | 0.1 | 0.5 |
| Food excluding fresh products, meat, milk and exotic products | 744 | 100.69 | 0.1 | 0.6 |
| Manufactured products | 2136 | 99.55 | 0.1 | −0.2 |
| Services including actual rentals and services for dwellings | 3254 | 102.48 | 0.1 | 0.9 |
| HICP - All items | 101.58 | −0.2 | 1.1 | |
- * Core inflation indicator excludes public sector prices, the most volatile consumer prices and the tax measures. Seasonally adjusted, this index is calculated for all households in France excluding overseas departments and territories. (in French “indice d'inflation sous-jacent - ISJ”)
- **HICP: Harmonised Indices of Consumer Prices are inflation figures designed for international comparison between Member states of the European Union. This index is calculated for all households in France excluding Mayotte.
- Source: INSEE - Consumer Price Indices
Revisions
Compared with the provisional estimates published on 29 September 2017, the month-on-month change in the CPI and the HICP was diminished by 0.1 point and the year-on-year changes were confirmed.
Pour en savoir plus
