


 26 September 2017
2017- n° 252In September 2017, the business climate improves again in services Monthly survey of services - September 2017
26 September 2017
2017- n° 252In September 2017, the business climate improves again in services Monthly survey of services - September 2017
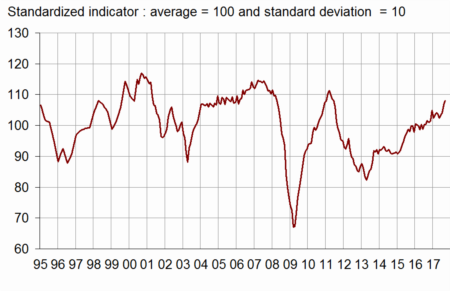
According to business managers surveyed in September 2017, the business climate in services has improved for the fourth month in a row. The business climate composite indicator has increased by one point (108) and stands clearly above its average (100). It is at its highest level since June 2011.
Because of late businesses' answers that have been taken into account, the indicator in August has been revised upward by one point.
- Past activity deemed on the rise and strong general outlook
- In road transport, the business climate has weakened sligthly
- In accommodation and food services, the business climate has reached a level unseen since September 2011
- The business climate is at its highest level since June 2011 in information and communication
- In real estate activities, the business climate has improved slightly
- In professional, scientific and technical activities, the business climate remains stable
- The business climate has improved in administrative and support service activities
According to business managers surveyed in September 2017, the business climate in services has improved for the fourth month in a row. The business climate composite indicator has increased by one point (108) and stands clearly above its average (100). It is at its highest level since June 2011.
Because of late businesses' answers that have been taken into account, the indicator in August has been revised upward by one point.
graphiqueGraph 1 – Business climate composite indicator
The turning point indicator remains in the area indicating a favourable short-term economic situation.
graphiqueGraph 2 – Turning point indicator
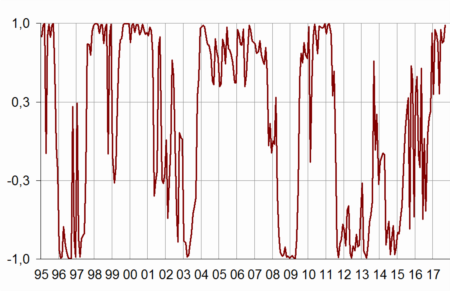
- Note: close to 1 (respectively -1), this indicator indicates a favourable short-term economic situation (respectively unfavourable). The uncertainty area is between −0.3 and +0.3.
Past activity deemed on the rise and strong general outlook
The balance on past activity has increased again. The balances on expected demand and activity remain high. The balance on general outlook, which relates the assessment of business leaders over their whole sector, is stable. These four balances are well above their long-term average.
The balances on past and expected selling prices have risen and have reached or exceeded their long-term average. They stand at a level unseen since spring 2012.
The balance on past employment is virtually stable, that on expected employment is steady overall and has increased for services except temporary work agencies. All balances on employment are above their average.
The balance on past investments is virtually stable and that on expected investments is unchanged. Both remain above their average.
tableauTable 1 – Economic outlook in the services sector
| Average* | June 17 | July 17 | Aug. 17 | Sept. 17 | |
|---|---|---|---|---|---|
| Composite indicator | 100 | 103 | 104 | 107 | 108 |
| General outlook | –8 | 0 | 2 | 3 | 3 |
| Past activity | 2 | 2 | 3 | 7 | 9 |
| Expected activity | 2 | 1 | 4 | 7 | 7 |
| Expected demand | –1 | 1 | 0 | 5 | 6 |
| Past selling prices | –4 | –5 | –10 | –9 | –4 |
| Expected selling prices | –3 | –4 | –7 | –6 | –1 |
| Past employment | 3 | 14 | 12 | 7 | 8 |
| except temporary work agencies | 1 | 6 | 5 | 3 | 3 |
| Expected employment | 2 | 5 | 6 | 6 | 6 |
| except temporary work agencies | –1 | 4 | 2 | 1 | 3 |
| Investments | |||||
| Past investments | 2 | 4 | 4 | 5 | 4 |
| Expected investments | 1 | 4 | 4 | 6 | 6 |
- * Average since 1989 for the composite indicator and since 1988 for the balances of opinion
- Source: INSEE, monthly business survey in services.
The business climate indicator stands clearly above its long-term average in all sub-sectors. It has improved in accommodation and food services, in administrative and support services and more slightly in information and communication and in real estate activities. It is stable in professional, scientific and technical activities. It has weakened slightly in road transport.
In road transport, the business climate has weakened sligthly
In road transport, the business climate has decreased by one point (109). However, it stands well above its long-term average. The balances on expected demand, on general outlook and on past employment have gone down, while remaining above their long-term average. The balance on expected activity has increased slightly.
In accommodation and food services, the business climate has reached a level unseen since September 2011
In accommodation and food services, the business climate has gained two points (109) mainly because of the increase in the balances on expected demand and on past activity. In contrast, the balances on expected activity and on expected employment have declined.
The business climate is at its highest level since June 2011 in information and communication
In information and communication, the business climate has gone up again (+1 point). At 106, it stands clearly above its long-term average. The balance on past activity has increased sharply. However, the balances on expected demand and on past employment have gone down.
In real estate activities, the business climate has improved slightly
After a clear decrease in August, the business climate has edged up by one point. The balances on activity, on expected employment and general outlook have increased. In contrast, the balances on expected demand and past employment have decreased. The last one has moved below its long-term average.
In professional, scientific and technical activities, the business climate remains stable
The business climate in professional, scientific and technical activities is steady at 107, well above its long-term average. The balance on expected activity has fallen back but remains above its long-term average. All the other balances are either up or stable.
The business climate has improved in administrative and support service activities
In administrative and support service activities, the business climate indicator has gone up by two points and exceeds even more its average (107). All the balances are either up or virtually stable, above their average.
tableauTable 2 – Business climate composite indicator and balances of opinion by sub-sector in services
| Aggregated classification (NA 2008) at level A21 | Mean* | June 17 | July 17 | Aug. 17 | Sept. 17 |
|---|---|---|---|---|---|
| Road transport (8%) | |||||
| Composite indicator | 100 | 110 | 109 | 110 | 109 |
| Past activity | –7 | 2 | 13 | 7 | 7 |
| Expected activity | –8 | 6 | 0 | 2 | 4 |
| Expected demand | –11 | 6 | 1 | 6 | 1 |
| Past employment | –6 | 5 | 11 | 9 | 5 |
| Expected employment | –9 | 5 | 3 | 3 | 3 |
| General outlook | –22 | –2 | 4 | 5 | 2 |
| Accommodation and food service activities (11%) | |||||
| Composite indicator | 100 | 103 | 100 | 107 | 109 |
| Past activity | –7 | –6 | –14 | –1 | 2 |
| Expected activity | –7 | –3 | –2 | 2 | –4 |
| Expected demand | –10 | –10 | –11 | –6 | 2 |
| Past employment | –4 | –4 | –9 | 0 | 1 |
| Expected employment | –6 | –7 | –8 | –8 | –11 |
| General outlook | –14 | –6 | –13 | –5 | –2 |
| Information and communication (24%) | |||||
| Composite indicator | 100 | 99 | 100 | 105 | 106 |
| Past activity | 8 | –5 | –8 | 12 | 18 |
| Expected activity | 9 | –3 | 9 | 16 | 16 |
| Expected demand | 10 | 1 | –1 | 17 | 11 |
| Past employment | 6 | 10 | 15 | 15 | 5 |
| Expected employment | 10 | 11 | 13 | 17 | 19 |
| General outlook | 0 | 3 | 4 | 4 | 3 |
| Real estate activities (13%) | |||||
| Composite indicator | 100 | 105 | 109 | 103 | 104 |
| Past activity | 7 | 12 | 18 | 9 | 11 |
| Expected activity | 8 | 10 | 13 | 9 | 13 |
| Expected demand | 1 | 5 | 6 | 6 | 4 |
| Past employment | 3 | 5 | 10 | 4 | –3 |
| Expected employment | 2 | 1 | 0 | 1 | 6 |
| General outlook | –2 | 6 | 8 | 2 | 5 |
| Professional, scientific and technical activities (24%) | |||||
| Composite indicator | 100 | 105 | 106 | 107 | 107 |
| Past activity | –1 | 5 | 5 | 4 | 4 |
| Expected activity | –2 | –3 | 2 | 6 | 3 |
| Expected demand | –6 | –3 | –1 | 0 | 2 |
| Past employment | 1 | 12 | 6 | –1 | 2 |
| Expected employment | 0 | 13 | 5 | 9 | 10 |
| General outlook | –9 | –1 | –2 | –3 | 0 |
| Administrative and support service activities (18%) | |||||
| Composite indicator | 100 | 105 | 103 | 105 | 107 |
| Past activity | 6 | 13 | 10 | 12 | 13 |
| Expected activity | 5 | 8 | 1 | 4 | 7 |
| Expected demand | 3 | 8 | 2 | 4 | 10 |
| Past employment | 9 | 29 | 26 | 13 | 17 |
| Expected employment | 8 | 5 | 11 | 9 | 12 |
| General outlook | –4 | 2 | 6 | 10 | 9 |
- The figures in parentheses indicate the weights used to aggregate the sub-sector balances of opinion.
- *Composite indicators: average since 1989 (2006 for road transport); balances of opinion : average since 1988 (2006 for road transport)
- Source : INSEE, monthly business survey in services.
Documentation
Abbreviated Methodology (2017) (pdf,177 Ko)
Pour en savoir plus
Time series : Economic outlook surveys – Services
