


 2 October 2017
2017- n° 236The prices of second-hand dwellings and the volume of transactions were still increasing
in Q2 2017 Notaries-INSEE second-hand dwellings price index - second quarter 2017
2 October 2017
2017- n° 236The prices of second-hand dwellings and the volume of transactions were still increasing
in Q2 2017 Notaries-INSEE second-hand dwellings price index - second quarter 2017
2 October 2017: The file of additional data has been updated compared to the publication of 7 September 2017.
In Q2 2017, the prices of second-hand dwellings kept increasing: +1.0% compared to the previous quarter (provisional seasonally adjusted results). The increase is clearly more important for flats (+1.6%) than for houses (+0.6%).
Over a year, the increase in prices continued to become more significant: +3.4% compared to Q2 2016 after +2.5% the quarter before. For the third quarter in a row, this increase was larger for flats (+4.2%) than for houses (+2.9%).
In Île-de-France, the prices of second-hand dwellings rose further
In Q2 2017, the prices of second-hand dwellings in Île-de-France continued to rise: +1.3% compared to Q1 2017, as in the quarter before.
Year–on–year, the rise in prices intensified: +3.9% compared to the same quarter of 2016, after +3.4% at the beginning of 2017 and +2.6% at the end of 2016. This acceleration came from a more accentuate rise in the prices of flats (+4.9% over the year, after +4.1%), especially for the flats in Paris which increased by 6.6% in one year. The rise in the prices of houses in Île-de-France was less marked and more regular (+1.9% after +2.0%).
In provincial France, prices of second-hand dwellings accelerated less strongly than in Île-de-France
In provincial France, the prices of second-hand dwelling rose by 0.9% between the first and the second quarter of 2017, which is less marked than in the previous quarter (+1.2%).
Over one year, the prices increased less markedly than in Île-de-France, though they have accelerated since the beginning of the year: +3.2% between Q2 2016 and Q2 2017, after +2.0% in the previous quarter. Like in Île-de-France, the rise was more important for flats (+3.6%) than for houses (+3.1%).
graphiqueGraphique1a – Variation in prices of second-hand dwellings in metropolitan France over a year
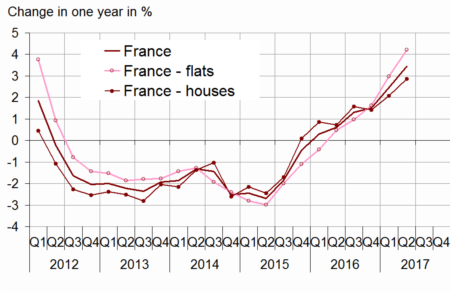
- Sources: INSEE, French notaries - Database Bien, Perval society
graphiqueGraphique2a – Prices of second-hand dwellings in Île-de-France
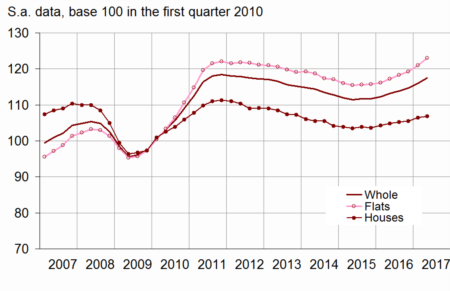
- Scope: Île-de-France
- Sources: INSEE, French notaries - Database Bien, Perval society
tableauTableau1a – Variation in prices of second-hand dwellings in metropolitan France
| change in | ||||||
|---|---|---|---|---|---|---|
| 3 months (S.A.) | 12 months | |||||
| 2016 Q4 | 2017 Q1 (sd) | 2017 Q2 (p) | 2016 Q4 | 2017 Q1 (sd) | 2017 Q2 (p) | |
| France | 0.4 | 1.3 | 1.0 | 1.5 | 2.5 | 3.4 |
| Flats | 0.7 | 1.4 | 1.6 | 1.6 | 3.0 | 4.2 |
| Houses | 0.2 | 1.2 | 0.6 | 1.4 | 2.1 | 2.9 |
- (p): provisional; (sd): semi-definitive
- Scope: Metropolitan France
- Sources: INSEE, French notaries - Database Bien, Perval society
The annual volume of transactions continued to grow
In Q2 2017, the annual transaction volume continued to grow: in June, the number of transactions carried out over the last twelve months reached a new historical peak (921,000). This volume of transactions was thus significantly higher than the one recorded one year earlier (819,000 in June 2016). This level has been reached in a context of trend growth in the number of existing dwellings (around +1% on average per year for thirty years).
graphiqueGraphique3a – Volume of transactions of second-hand dwellings over the last 12 months
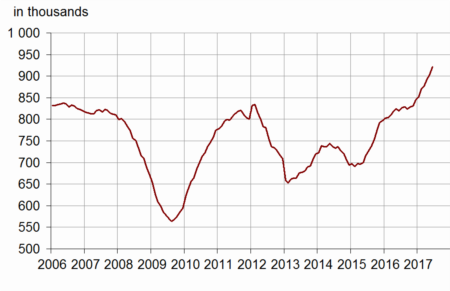
- Scope: France excluding Mayotte
- Sources: CGEDD, based on notarial databases and DGFiP (MEDOC)
Revisions
The second-hand housing price index is revised to include transactions recorded after the previous publication. Furthermore, for the publication of Q2 2017, the seasonal adjustment parameters have been revised. This could marginally change the figures from the beginning of 2008.
In comparison with the results released on 3 July 2017, the change in prices in Q1 2017 has been revised downwards by −0.3 points overall, for flats and for houses. The overall change in prices in Q1 2017 stands at +1.3%, instead of +1.6% (figure published on 3 July) and +1.9% estimated on 30 May.
tableauTableau2a – Variation in prices of second-hand dwellings in metropolitan France
| Change in | ||||||
|---|---|---|---|---|---|---|
| 3 months (S.A.) | 12 months | |||||
| 2016 Q4 | 2017 Q1 (sd) | 2017 Q2 (p) | 2016 Q4 | 2017 Q1 (sd) | 2017 Q2 (p) | |
| Metropolitan France | 0.4 | 1.3 | 1.0 | 1.5 | 2.5 | 3.4 |
| - Flats | 0.7 | 1.4 | 1.6 | 1.6 | 3.0 | 4.2 |
| - Houses | 0.2 | 1.2 | 0.6 | 1.4 | 2.1 | 2.9 |
| Île-de-France | 0.6 | 1.3 | 1.3 | 2.6 | 3.4 | 3.9 |
| Provincial France | 0.3 | 1.2 | 0.9 | 1.1 | 2.0 | 3.2 |
| Flats | ||||||
| Île-de-France | 0.8 | 1.5 | 1.7 | 3.0 | 4.1 | 4.9 |
| - Paris | 1.4 | 1.6 | 2.5 | 4.3 | 5.5 | 6.6 |
| - Seine-et-Marne | 0.5 | 1.7 | -0.8 | 0.7 | 3.2 | 2.4 |
| - Yvelines | 0.7 | 0.4 | 0.6 | 2.1 | 2.1 | 2.2 |
| - Essonne | 0.0 | 1.4 | -0.5 | 0.2 | 2.0 | 1.4 |
| - Hauts-de-Seine | 0.2 | 1.5 | 1.9 | 2.5 | 3.3 | 4.4 |
| - Seine-Saint-Denis | -0.5 | 2.1 | 1.0 | 0.9 | 2.7 | 3.3 |
| - Val-de-Marne | 0.2 | 1.6 | 1.2 | 1.9 | 3.3 | 3.7 |
| - Val-d'Oise | 0.7 | 0.9 | -0.4 | 1.4 | 2.4 | 1.7 |
| Provincial France | 0.6 | 1.3 | 1.5 | 0.4 | 1.9 | 3.6 |
| - Conurbation > 10 000 inhabitants | 0.6 | 1.2 | ** | 0.5 | 1.8 | ** |
| - Central town | 0.6 | 1.4 | ** | 0.7 | 2.2 | ** |
| - Suburb | 0.7 | 0.9 | ** | 0.3 | 1.2 | ** |
| - Conurbation < 10 000 inhabitants | 0.2 | 2.3 | ** | -0.2 | 3.0 | ** |
| Houses | ||||||
| Île-de-France | 0.3 | 0.8 | 0.4 | 1.7 | 2.0 | 1.9 |
| - Seine-et-Marne | 0.4 | 1.0 | 0.1 | 1.3 | 2.1 | 1.9 |
| - Yvelines | 0.3 | 0.8 | 0.4 | 1.9 | 1.9 | 2.1 |
| - Essonne | 0.3 | 1.0 | 0.7 | 1.5 | 2.3 | 2.2 |
| - Hauts-de-Seine | 1.0 | -0.1 | 0.8 | 3.2 | 0.7 | 1.7 |
| - Seine-Saint-Denis | 0.2 | 1.2 | 0.6 | 1.1 | 2.8 | 2.1 |
| - Val-de-Marne | 0.3 | 0.9 | 0.6 | 1.8 | 2.0 | 1.9 |
| - Val-d'Oise | -0.1 | 1.2 | -0.4 | 1.2 | 2.4 | 1.4 |
| Provincial France | 0.1 | 1.2 | 0.7 | 1.4 | 2.1 | 3.1 |
| Nord-Pas de Calais | 0.4 | 0.8 | ** | 1.5 | 2.1 | ** |
| - Flats | 2.1 | 0.2 | ** | 2.1 | 2.0 | ** |
| - Houses | 0.1 | 0.9 | ** | 1.4 | 2.1 | ** |
| - Lille Houses | 0.1 | 0.2 | ** | 1.8 | 2.3 | ** |
| Provence-Alpes-Côte d'Azur | 0.5 | 0.6 | ** | 0.7 | 0.8 | ** |
| - Flats | 1.0 | 0.3 | ** | 0.6 | 1.3 | ** |
| - Houses | 0.1 | 0.9 | ** | 0.8 | 0.3 | ** |
| - Marseille Flats | -1.2 | 5.0 | ** | -2.6 | 5.2 | ** |
| Rhône-Alpes | 0.2 | 1.0 | ** | 1.3 | 2.2 | ** |
| - Flats | 0.0 | 1.7 | ** | 0.3 | 2.1 | ** |
| - Houses | 0.5 | 0.4 | ** | 2.4 | 2.3 | ** |
| - Lyon Flats | 0.6 | 1.3 | ** | 3.5 | 3.8 | ** |
- ** index released on 2 October 2017.
- Data for the first and the fourth quarter 2016 about Nord-Pas de Calais are calculated on the basis of cover rates slightly lower than the level asked by the Scientific Board of the Notaires-INSEE indexes, what affects their precision.
- (p): provisional ; (sd): semi-definitive
- Sources: INSEE, French notaries - Database Bien, Perval society
Pour en savoir plus
