


 29 August 2017
2017- n° 226Household consumption expenditure on goods bounced back in July 2017 (+0.7%) Household consumption expenditure on goods - July 2017
29 August 2017
2017- n° 226Household consumption expenditure on goods bounced back in July 2017 (+0.7%) Household consumption expenditure on goods - July 2017
In July 2017, household consumption expenditure on goods bounced back by 0.7% in volume terms*, after a fall of similar magnitude in June. Purchases of durables accelerated and expenses on food products bounced back.
In July 2017, household consumption expenditure on goods bounced back by 0.7% in volume terms*, after a fall of similar magnitude in June. Purchases of durables accelerated and expenses on food products bounced back.
graphiqueGraph1 – Total consumption of goods
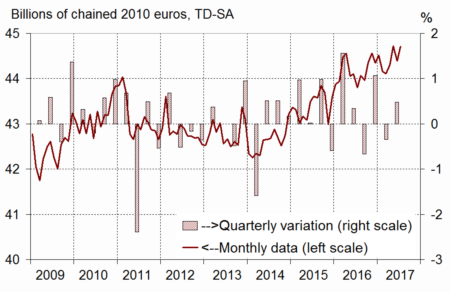
- Source: INSEE

*Volumes are measured at chain-link previous year prices (2010 euro billions) and all figures are trading-day and seasonally adjusted.
Engineered goods: rebound
In July 2017, purchases of engineered goods bounced back (+1.2% after −0.7%), due in particular to expenses on household durables and textile-clothing.
Durables: growth for the third consecutive month
Consumption of durables, growing since May, accelerated in July (+0.9% after +0.2%). Indeed, purchases of household durables picked up sharply (+2.7%), notably those of consumer electronic devices and household appliances (notebooks, refrigerators, etc.) as well as furniture.
However, expenses on transport equipment edged down (−0.2%): motorcycles purchases stepped back, partially offset by car purchases that were on the rise.
Textile-clothing: rebound
In July, expenses on textile-clothing recovered markedly after a strong fall in June.
Other engineered goods: slowdown
Expenses on « other engineered goods » slowed down in July (+0.2 % after +0.7%). Purchases of perfume and beauty products increased significantly for the second consecutive month. However, expenses on hardware fell back.
graphiqueGraph2 – Breakdown of engineered goods
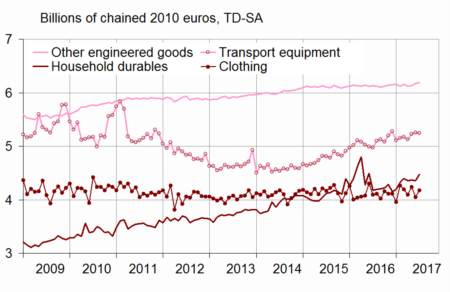
- Source: INSEE
Food products: rebound
In July 2017, total food consumption increased anew (+0.8%) after a fall in June (−1.0%). Purchases of raw products (fruits, vegetables) and processed food (beverage, milk products) bounced back clearly. However, consumption of tobacco diminished.
graphiqueGraph3 – Food products, engineered goods and energy
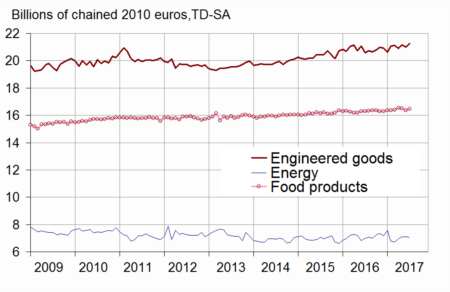
- Source: INSEE
Energy: slight decrease
Consumption of energy decreased at a moderate pace for the second consecutive month (−0.5% in July after −0.3%). Consumption of refined products diminished (−2.1%), notably in fuel and super unleaded.
graphiqueGraph4 – Breakdown of energy
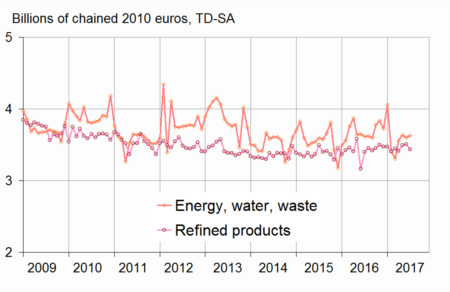
- Source: INSEE
The variation in June 2017 is revised upwards
Compared to the previous estimate, the variation in household expenditure on goods in June 2017 is slightly revised upwards: −0.7 % instead of −0.8 %. Since the previous publication, new information has been integrated and the seasonal adjustment coefficients have been updated.
tableauTable – Household consumption expenditure on goods
| Weight (1) | May 2017 | June 2017 | July 2017 | July 17 / July 16 | Q/Q-1 (2) | |
|---|---|---|---|---|---|---|
| Food products | 38 | 0.0 | –1.0 | 0.8 | 1.1 | 0.1 |
| - excl. Tobacco | 35 | –0.1 | –1.2 | 0.9 | 1.5 | 0.2 |
| Engineered goods | 45 | 1.3 | –0.7 | 1.2 | 3.4 | 0.6 |
| - Durables | 22 | 1.0 | 0.2 | 0.9 | 5.5 | 1.2 |
| Including : | ||||||
| - Transport equipment | 12 | 1.9 | 0.4 | –0.2 | 5.3 | 1.7 |
| - Household durables | 7 | 0.1 | –0.2 | 2.7 | 7.2 | 0.9 |
| - Textile-clothing | 9 | 3.7 | –4.6 | 3.1 | 2.0 | –0.7 |
| - Other engineered goods | 13 | 0.0 | 0.7 | 0.2 | 1.0 | 0.5 |
| Energy | 17 | 2.3 | –0.3 | –0.5 | 0.7 | 4.0 |
| - Energy, water, waste | 10 | 2.2 | –0.9 | 0.7 | 0.5 | 5.7 |
| - Refined Products | 7 | 2.4 | 0.4 | –2.1 | 1.0 | 1.7 |
| Total | 100 | 0.9 | –0.7 | 0.7 | 2.1 | 0.9 |
| - Including Manufactured goods | 84 | 0.7 | –0.6 | 0.7 | 2.3 | 0.3 |
- (1) Weighting in the consumption expenditure on goods in value in 2016
- (2) Last three months / previous three months
- Source: INSEE
Documentation
Methodology (pdf,23 Ko)
Pour en savoir plus
