


 25 July 2017
2017- n° 191In July 2017, the business climate increases slightly in services Monthly survey of services - July 2017
25 July 2017
2017- n° 191In July 2017, the business climate increases slightly in services Monthly survey of services - July 2017
According to business managers surveyed in July 2017, the business climate in services has improved slightly: the composite indicator which measures it has gained one point. At 104, it stands above its long-term average (100).
- Increasing business prospects
- The business climate remains high in road transport
- The business climate has returned to its mean in accommodation and food service activities
- In information and communication, the business climate fluctuates slightly around its long-term average
- The real estate business climate has improved again
- The business climate has improved slightly in professional, scientific and technical activities
- In administrative and support service activities, the business climate is less favourable

Warning : the seasonal coefficients have been updated in July 2017, as well as the parameters of the composite indicators. That has led to revisions in the set of results previously published in this survey may have changed.
According to business managers surveyed in July 2017, the business climate in services has improved slightly: the composite indicator which measures it has gained one point. At 104, it stands above its long-term average (100).
graphiqueGraph 1 – Business climate composite indicator

The turning point indicator stays in the area indicating a favourable short-term economic situation.
graphiqueGraph 2 – Turning point indicator
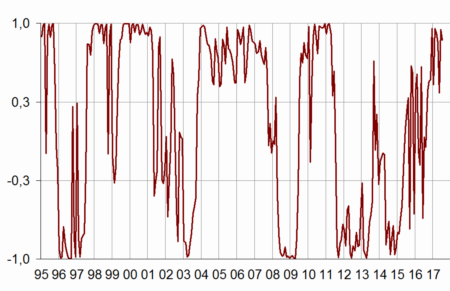
- Note: close to 1 (respectively −1), this indicator indicates a favourable short-term economic situation (respectively unfavourable). Between +0.3 and −0.3: uncertainty area.
Increasing business prospects
The balance of opinion on past activity has gone down just below its long-term average. However, for the coming months, more business leaders than in June anticipate an increase in activity, for their
own firm as well as for their whole sector. The corresponding balances have gone up and stand above their long-term average.
The balances on past and expected operating balance have increased and stand slightly above their long-term average.
The balance on past employment has decreased, whereas that on expected employment is virtually stable. Both balances stand clearly above their long-term average.
tableauTable 1 – Economic outlook in the services sector
| Average* | April 17 | May 17 | June 17 | July 17 | |
|---|---|---|---|---|---|
| Composite indicator | 100 | 104 | 102 | 103 | 104 |
| General outlook | –8 | –1 | 0 | 0 | 2 |
| Past activity | 2 | 5 | 1 | 2 | 0 |
| Expected activity | 2 | 1 | 0 | 1 | 5 |
| Expected demand | –1 | 2 | –2 | 1 | 1 |
| Past selling prices | –4 | –6 | –6 | –5 | –9 |
| Expected selling prices | –3 | –5 | –6 | –4 | –6 |
| Past employment | 3 | 13 | 13 | 14 | 10 |
| except temporary work agencies | 1 | 4 | 4 | 6 | 4 |
| Expected employment | 2 | 13 | 10 | 5 | 6 |
| except temporary work agencies | –1 | 4 | 4 | 4 | 2 |
| Investments | |||||
| Past investments | 2 | 9 | 8 | 4 | 4 |
| Expected investments | 1 | 1 | 8 | 4 | 4 |
| Operating balance result | |||||
| Past result | –2 | –3 | –1 | ||
| Expected result | –2 | –3 | –1 | ||
| Cash position | –11 | –10 | –9 | ||
| Difficulties of supply and demand | |||||
| difficulties of supply and demand | 10 | 13 | 8 | ||
| difficulties of supply only | 22 | 24 | 29 | ||
| difficulties of demand only | 32 | 30 | 27 | ||
| Difficulties in recruitment | 28 | 29 | 32 |
- * Average since 1989 for the composite indicator and since 1988 for the balances of opinion
- Source: INSEE, business survey in services
The business climate indicator stands above its long-term average (100) in all services sub-sectors. It is particularly favourable in road transport (110), real estate (108) and professional, scientific and technical activities (106). However, it stands just at its average in accommodation and food service activities and in information and communication.
The business climate remains high in road transport
In road transport, the business climate is stable (110), clearly above its long-term average. The balances on past activity and employment and on general outlook have gone up. The balance on expected activity has declined but remains clearly above its long-term average.
The business climate has returned to its mean in accommodation and food service activities
In accommodation and food service activities, the business climate has lost three points and has come back to its long-term average (100). The balance on past activity has fallen back clearly below its long-term average. The balances on past employment and general outlook have gone down too. However, the balance on expected activity, on the rise, remains above its long-term average.
In information and communication, the business climate fluctuates slightly around its long-term average
In information and communication, the business climate has gained one point and has come back to its long-term average. The personal expectations on activity have improved markedly; the corresponding balance has returned just above its long term average. However, the balance on past activity has declined, deviating further from its long-term average. The balances on employment are almost unchanged, above their long-term average.
The real estate business climate has improved again
In real estate, the business climate has gained three points. At 108, it stands clearly above its long-term average. The balances on activity and general outlook have increased and stand even more above their long-term average.
The business climate has improved slightly in professional, scientific and technical activities
In professional, scientific and technical activities, the business climate has gained one point (106). The balance on expected activity has increased, returning above its long term average. The balances on employment have declined but remain above their long-term average.
In administrative and support service activities, the business climate is less favourable
In administrative and support service activities, the business climate has decreased by two points (to 103) but remains above its long term average. The balances on past activity and demand have gone down; that on expected activity has returned below its mean.
The balance on past employment has edged down, while remaining far above its long-term average; that on expected employment has bounced back.
tableauTable 2 – Business climate composite indicator and balances of opinion by sub-sector in services
| Aggregated classification (NA 2008) at level A21 | Mean* | April 17 | May 17 | June 17 | July 17 |
|---|---|---|---|---|---|
| Road transport (8%) | |||||
| Composite indicator | 100 | 106 | 108 | 110 | 110 |
| Past activity | –8 | 2 | –11 | 2 | 7 |
| Expected activity | –9 | –4 | 4 | 6 | 3 |
| Expected demand | –12 | –2 | 0 | 6 | 6 |
| Past employment | –7 | 6 | 8 | 5 | 8 |
| Expected employment | –9 | 1 | 7 | 5 | 4 |
| General outlook | –22 | –9 | 1 | –2 | 4 |
| Accommodation and food service activities (11%) | |||||
| Composite indicator | 100 | 108 | 102 | 103 | 100 |
| Past activity | –7 | –6 | –8 | –6 | –19 |
| Expected activity | –7 | –4 | –2 | –3 | 1 |
| Expected demand | –10 | 4 | –8 | –10 | –9 |
| Past employment | –4 | –4 | –1 | –4 | –12 |
| Expected employment | –6 | –4 | –8 | –7 | –7 |
| General outlook | –14 | –5 | –15 | –6 | –15 |
| Information and communication (24%) | |||||
| Composite indicator | 100 | 100 | 99 | 99 | 100 |
| Past activity | 8 | 0 | –3 | –5 | –10 |
| Expected activity | 9 | –3 | –9 | –3 | 10 |
| Expected demand | 10 | –2 | –5 | 1 | 0 |
| Past employment | 6 | 9 | 5 | 10 | 11 |
| Expected employment | 10 | 14 | 15 | 11 | 12 |
| General outlook | 0 | –1 | 2 | 3 | 4 |
| Real estate activities (13%) | |||||
| Composite indicator | 100 | 103 | 103 | 105 | 108 |
| Past activity | 7 | 10 | 8 | 12 | 16 |
| Expected activity | 8 | 8 | 10 | 10 | 12 |
| Expected demand | 1 | 4 | 2 | 5 | 6 |
| Past employment | 3 | 6 | 4 | 5 | 7 |
| Expected employment | 2 | 7 | 5 | 1 | 0 |
| General outlook | –2 | 2 | 6 | 6 | 8 |
| Professional, scientific and technical activities (24%) | |||||
| Composite indicator | 100 | 105 | 103 | 105 | 106 |
| Past activity | –1 | 4 | 4 | 5 | 6 |
| Expected activity | –2 | –2 | –3 | –3 | 2 |
| Expected demand | –6 | 1 | –2 | –3 | 1 |
| Past employment | 1 | 6 | 7 | 12 | 6 |
| Expected employment | 0 | 8 | 9 | 13 | 6 |
| General outlook | –9 | –2 | –5 | –1 | –2 |
| Administrative and support service activities (18%) | |||||
| Composite indicator | 100 | 107 | 107 | 105 | 103 |
| Past activity | 6 | 15 | 11 | 13 | 8 |
| Expected activity | 5 | 11 | 11 | 8 | 1 |
| Expected demand | 3 | 9 | 7 | 8 | 3 |
| Past employment | 9 | 30 | 30 | 29 | 25 |
| Expected employment | 7 | 25 | 20 | 5 | 10 |
| General outlook | –5 | 5 | 6 | 2 | 6 |
- The figures in parentheses indicate the weights used to aggregate the sub-sector balances of opinion.
- *Composite indicators: average since 1989 (2006 for road transport); balances of opinion : average since 1988 (2006 for road transport)
- Source: INSEE, monthly business survey in services.
Documentation
Abbreviated Methodology (2017) (pdf,177 Ko)
Pour en savoir plus
Time series : Economic outlook surveys – Services
