


 30 June 2017
2017- n° 179In May 2017, rise in overall agricultural prices of 5.4% over one year Indices of agricultural prices - May 2017
30 June 2017
2017- n° 179In May 2017, rise in overall agricultural prices of 5.4% over one year Indices of agricultural prices - May 2017
In mai 2017, overall agricultural prices increased by 5.4% over one year, after +6.6% in April. Excluding fruits and vegetables, they decreased by 0.5% over one month and rose by 6.1 % over one year.
In mai 2017, overall agricultural prices increased by 5.4% over one year, after +6.6% in April. Excluding fruits and vegetables, they decreased by 0.5% over one month and rose by 6.1 % over one year.
Further drop in cereals and oleaginous prices
In May 2017, cereal prices declined again (−1.1%, after −2.7% in April), those of oleaginous as well (−6.2% after −3.2%). The supply of cereal was already ample and significant crops were expected, especially in Russia for soft wheat. Prices of cereals and oleaginous, which are widely exported goods, also decreased to offset a higher euro value towards dollar. In addition the prices of rape, the main oleaginous grown in France, were driven down by soy prices, as these two goods are substitutable. The fall in the Brazilian currency weighted on soy prices while the forecasts showed an abundant crop in Latin America.
graphiqueGraph1 – Producer prices of cereals
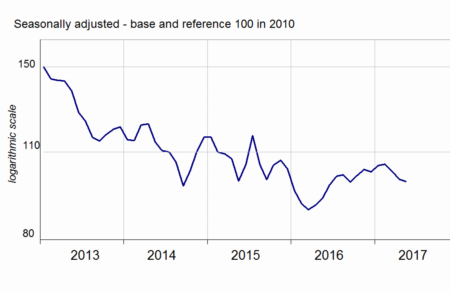
- Source: INSEE
Fresh vegetables prices went down; fresh fruits and potatoes prices remained dynamic
In May 2017, fresh vegetables prices decreased over one year (−3.8%). The demand for tomatoes and cucumbers was sluggish towards the seasonal greenhouse production rise. Fresh fruits prices remained dynamic (+3.5% over one year). Cherries production went back to a normal level compared to the low crop last year. Potatoes prices remained higher than last year (+13.4%) reflecting the weak yields of the last production campaign in North-Western Europe.
Wine prices broadly increased by 0.6% over one year: protected designation of origin wine prices rose by 4.7% whereas prices of wines without protected designation of origin (“other wines”), facing competition with spanish ones, dropped by 14.0%.
graphiqueGraph2 – Producer prices of fresh vegetables
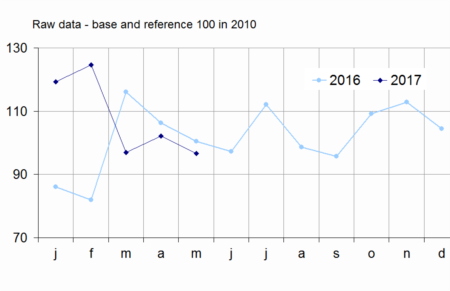
- Source: SSP (ministry in charge of agriculture)
Animals and milk prices still increased
Over one year, animal prices increased (+6.9%) mainly due to the rise in pig prices (+22.1%), in line with China's dynamic demand and, to a lesser extent, to the upturn in large cattle prices (+5.0%).
graphiqueGraph3 – Producer prices of pigs and large cattle
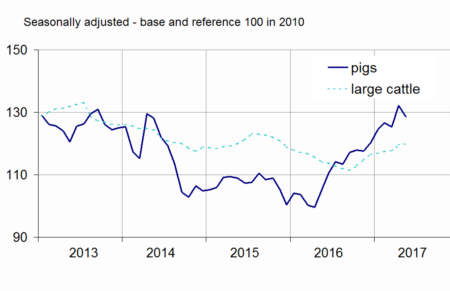
- Source: INSEE
Cow milk price rose again (+2.4% from February to April). Global milk collection has been decreasing since mid 2016 while the industy barely kept up with the demand for butter.
tableauTable1 – Indice of producer prices of agricultural products (IPPAP)
| Variation as % over | |||||
|---|---|---|---|---|---|
| Weights | May 2017 | a month | 3 months | a year | |
| Agricultural goods output | 1000 | 116.4 | /// | /// | +5.4 |
| excluding fruits and vegetables | 900 | 118.1 | –0.5 | –0.9 | +6.1 |
| Crop output (excluding fruits and vegetables) | 505 | 120.1 | –0.6 | –2.8 | +3.5 |
| Cereals | 188 | 98.7 | –1.1 | –6.3 | +6.1 |
| of which soft wheat | 112 | 95.2 | –1.6 | –8.2 | +9.7 |
| grain maize | 41 | 100.5 | –0.9 | –2.7 | +4.0 |
| Potatoes | 26 | 239.0 | /// | /// | +13.4 |
| Wines | 177 | 134.7 | +1.5 | +1.7 | +0.6 |
| protected designation of origin | 84 | 148.5 | +3.2 | +4.0 | +4.7 |
| other wines | 23 | 129.9 | –2.1 | –4.4 | –14.0 |
| Oleaginous | 49 | 97.9 | –6.2 | –11.8 | –0.4 |
| Horticultural products | 30 | 110.7 | –0.4 | +2.2 | –0.4 |
| Other crop products | 36 | 111.4 | +0.3 | –1.5 | +2.9 |
| Fruits and vegetables (1) | 100 | 101.8 | /// | /// | –0.9 |
| Fresh vegetables | 53 | 96.7 | /// | /// | –3.8 |
| Fresh fruits | 35 | 105.4 | /// | /// | +3.5 |
| Animal output | 395 | 115.5 | –0.5 | +1.8 | +9.7 |
| Animals | 234 | 117.7 | –0.6 | +1.0 | +6.9 |
| of which large cattle | 96 | 119.9 | +0.3 | +2.0 | +5.0 |
| calves | 26 | 105.4 | –2.6 | –4.5 | –0.7 |
| pigs | 54 | 128.6 | –2.7 | +1.6 | +22.1 |
| sheep | 10 | 114.8 | +3.5 | +7.7 | +2.8 |
| poultry | 46 | 108.5 | +0.6 | –0.4 | –1.0 |
| of which chicken | 28 | 108.1 | +0.9 | –0.5 | –1.2 |
| Milk | 147 | 109.7 | /// | +2.2 | +11.1 |
| of which cow milk (2) | 137 | 109.6 | /// | +2.4 | +12.1 |
| Eggs | 15 | 137.9 | –3.6 | +8.2 | +48.1 |
- * Except for fresh fruits, fresh vegetables and potatoes
- /// Absence of meaning due to the nature of these series
- (1) Including vegetables for industry.
- (2)The April value of cow milk price indice has been carried forward in May.
- Sources: INSEE, SSP (ministry in charge of agriculture)
Decline in purchase prices of means of production
In May 2017, intermediate consumption prices decreased by 0.7% as a result of the decline in energy (−3,6%) and fertilisers prices (−2,0%). Over one year, they increased by 0.4%, in line with energy prices (+4.6%) and those of feed (+1.8%) whereas fertilisers prices kept going down (−4.8%). Capital goods prices grew by 0.4% over the month and by 1.8 % over one year.
Revisions
The variation over one year of IPPAP has been raised by 0.2 point in April and that of IPAMPA has been lowered by 0.1 point.
graphiqueGraph4 – Purchase prices of the means of agricultural production
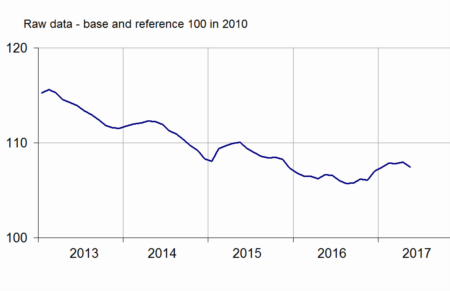
- Sources: INSEE, SSP (ministry in charge of agriculture)
tableauTable2 – Indices of purchase prices of the means of agricultural production (IPAMPA)
| Variation as % over | |||||
|---|---|---|---|---|---|
| Weights | May 2017 | a month | 3 months | a year | |
| Total input | 1000 | 107.4 | –0.5 | –0.5 | +0.7 |
| Intermediate consumptions | 764 | 107.0 | –0.7 | –0.7 | +0.4 |
| Energy | 100 | 97.4 | –3.6 | –5.0 | +4.6 |
| Seeds | 57 | 106.5 | 0.0 | +0.2 | –1.8 |
| Fertilisers and soil improvers | 92 | 103.7 | –2.0 | –1.8 | –4.8 |
| Plant protection products | 78 | 98.4 | +0.1 | +0.8 | –0.7 |
| Animal feed | 205 | 113.4 | –0.4 | –0.1 | +1.8 |
| Veterinary expenses | 43 | 119.4 | +0.1 | +0.3 | +1.5 |
| Small equipment and tools | 17 | 107.1 | +0.2 | 0.0 | –0.9 |
| Maintenance of materials | 67 | 115.4 | +0.2 | +0.4 | +1.9 |
| Maintenance of buildings | 9 | 108.4 | 0.0 | +0.2 | +2.0 |
| Other goods and services | 97 | 102.4 | 0.0 | 0.0 | –0.8 |
| Goods and services contributing to investment | 236 | 108.7 | +0.4 | +0.6 | +1.8 |
| Material | 186 | 109.9 | +0.5 | +0.7 | +1.6 |
| Tractors | 79 | 110.9 | +0.7 | +0.9 | +2.3 |
| Machinery and equipment for cultivation | 36 | 111.8 | +0.4 | +1.4 | +0.9 |
| Machinery and equipment for harvesting | 42 | 109.8 | +0.2 | +0.1 | +1.6 |
| Utility vehicles | 18 | 104.2 | –0.3 | +0.2 | +0.1 |
| Buildings | 50 | 104.5 | 0.0 | +0.1 | +2.9 |
- (1) The repayment of the domestic tax on energy product (TICPE) benefiting farmers has been applied in advance for the year 2017.
- Sources: INSEE, SSP (ministry in charge of agriculture)
Documentation
Methodology (pdf,122 Ko)
Pour en savoir plus
Time series : Indices of agricultural prices
