


 30 June 2017
2017- n° 172Household consumption expenditure on goods sped up in May (+1.0%) Household consumption expenditure on goods - May 2017
30 June 2017
2017- n° 172Household consumption expenditure on goods sped up in May (+1.0%) Household consumption expenditure on goods - May 2017
In May 2017, household expenditure on goods increased by 1.0% in volume*, after +0.4% in April. Car and clothing purchases bounced back sharply. In contrast, spending on energy and food products slowed down.
In May 2017, household expenditure on goods increased by 1.0% in volume*, after +0.4% in April. Car and clothing purchases bounced back sharply. In contrast, spending on energy and food products slowed down.

*Volumes are measured at chain-link previous year prices (2010 euro billions) and all figures are trading-day and seasonally adjusted.
graphiqueGraph1 – Total consumption of goods
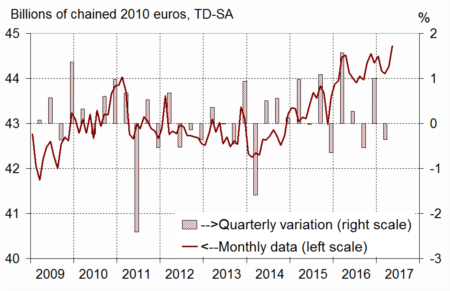
- Source: INSEE
Engineered goods: marked rebound
In May 2017, purchases of engineered goods picked up (+1.5% after −1.1%), driven by spending on durables (+1.0% after −0.9%) and on clothing.
Durables: recovery
In May, car purchases bounced back (+2.0% after −1.0%), notably new and used vehicules, as well as recreational vehicules (mortorhomes). Spending on household durables other than cars was stable after a decline of 0.9% in April: a decrease in purchases of consumer electronics was offset by a rise in communication equipment (notably smartphones). Furthermore, purchases of cameras dropped, as in April.
Textile-clothing: rebound
In May, spending on textile-clothing soared (+4.6% after −2.2% in April). In particular, purchases of clothes and shoes bounced back after two months of decline.
Other engineered goods: slight rise
In May, purchases of “other engineered goods” picked up slightly (+0.2% after −0.6%). Expenditure on hardware and DIY materials fell again, while purchases of perfumes bounced back.
graphiqueGraph3 – Breakdown of engineered goods
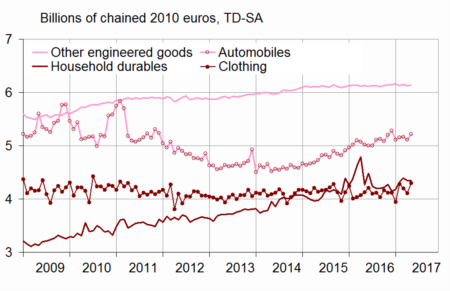
- Source: INSEE
Energy: lower increase
In May 2017, energy consumption slowed down slightly (+2.3% after 3.4%). Expenditure on gas and electricity lost steam while consumption of refined products bounced back (+2.5% after −1.4%), in particular in diesel and liquefied petroleum gas (LPG).
graphiqueGraph2 – Breakdown of energy
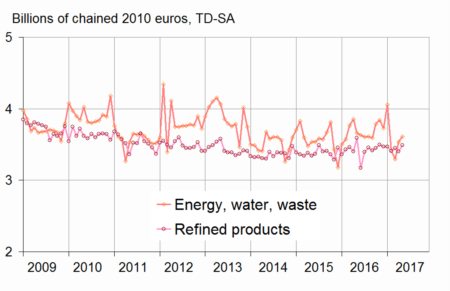
- Source: INSEE
Food products: virtual stability
In May 2017, consumption of food products was almost unchanged (−0.1%), after a sharp rise in April (+0.8%). Consumption of unprocessed agricultural goods increased for the third consecutive month, whereas spending on agrifood products fell back, in particular in meat products.
graphiqueGraph4 – Food products, engineered goods and energy
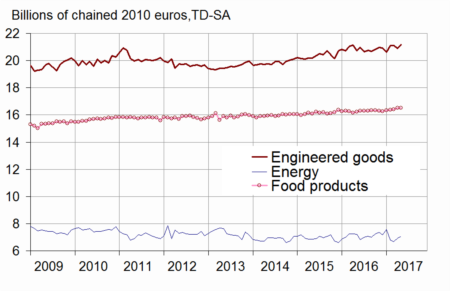
- Source: INSEE
The variation in April 2017 is slightly revised downwards
Compared to the previous estimate, the variation of household expenditure on goods in April 2017 has been revised downwards by 0.1 points, at +0.4%. Since the previous publication, new information has been integrated, particularly concerning household durables other than cars, and the seasonal adjustment coefficients have been updated.
tableauTable – Household consumption expenditure on goods
| Weight (1) | Mar. 2017 | Apr. 2017 | May. 2017 | May. 17 / May. 16 | Q / Q-1 (2) | |
|---|---|---|---|---|---|---|
| Food products | 38 | 0.2 | 0.8 | –0.1 | 1.9 | 1.0 |
| - excl. Tobacco | 35 | 0.7 | 1.0 | –0.1 | 2.3 | 1.3 |
| Engineered goods | 45 | 0.1 | –1.1 | 1.5 | 2.2 | 0.9 |
| - Durables | 22 | 0.6 | –0.9 | 1.0 | 2.7 | 0.9 |
| Including : | ||||||
| - Automobiles | 12 | 0.2 | –1.0 | 2.0 | 4.0 | –0.3 |
| - Household durables | 7 | 1.5 | –0.9 | 0.0 | 2.0 | 3.3 |
| - Textile-clothing | 9 | –1.8 | –2.2 | 4.6 | 4.1 | 2.1 |
| - Other engineered goods | 13 | 0.6 | –0.6 | 0.2 | 0.1 | –0.1 |
| Energy | 17 | –1.4 | 3.4 | 2.3 | –2.0 | –4.0 |
| - Energy, water, waste | 10 | –3.6 | 7.4 | 2.1 | –1.2 | –6.8 |
| - Refined Products | 7 | 1.3 | –1.4 | 2.5 | –2.9 | –0.1 |
| Total | 100 | –0.1 | 0.4 | 1.0 | 1.3 | 0.1 |
| - Including Manufactured goods | 84 | 0.0 | –0.5 | 0.8 | 1.5 | 0.6 |
- (1) Weighting in the consumption expenditure on goods in value in 2016
- (2) Last three months / previous three months
Documentation
Methodology (pdf,23 Ko)
Pour en savoir plus
