


 15 June 2017
2017- n° 156In May 2017, the prices of frequently purchased goods rose by 0.2% in hyper and supermarkets Price Index in large and predominantly-food stores - May 2017
15 June 2017
2017- n° 156In May 2017, the prices of frequently purchased goods rose by 0.2% in hyper and supermarkets Price Index in large and predominantly-food stores - May 2017
In May 2017, the prices of frequently purchased goods in hyper and supermarkets and in large and predominantly food stores slightly accelerated: +0.2% after +0.1% in the two previous months.
In May 2017, the prices of frequently purchased goods in hyper and supermarkets and in large and predominantly food stores slightly accelerated: +0.2% after +0.1% in the two previous months.
Excluding hyper and supermarkets, the prices of frequently purchased goods increased by 0.2%, as in April.
Considering all the kinds of stores, the prices of frequently purchased goods rose a little faster than in April (+0.2% after +0.1%).
Year on year, the prices in hyper and supermarkets accelerated
Compared with the same month last year, the prices of frequently purchased goods sold in hyper and supermarkets speeded up after starting to pick up in the previous month: +0,3% after +0.1% in April. In the same way, prices rose more sharply than in the previous month in large and predominantly food stores (+0.3% after +0.1%).
In the other kinds of stores, the prices of frequently purchased goods increased more sharply: +1.4% over a year after +1.1% in the five previous months.
Considering all stores, the prices of frequently purchased goods were more dynamic than in the previous month: +0.4% year on year after +0.2%. This rise has been the strongest since October 2013.
graphiqueGraph1 – Prices of frequently purchased goods year-on-year change %
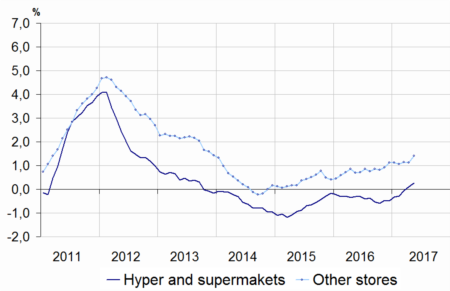
- Geographical coverage: metropolitan France
- Source: INSEE - Consumer Price Indexes
graphiqueGraph2 – Frequently purchased goods price indexes by main items
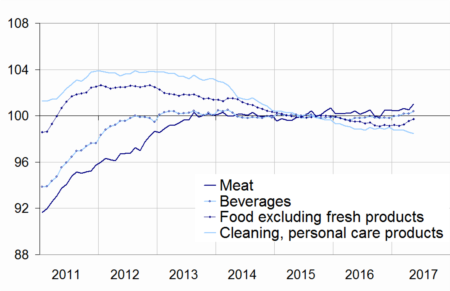
- Geographical coverage: metropolitan France
- Source: INSEE - Consumer Price Indexes
tableauTable1 – Prices of frequently purchased goods
| Index | Changes (%) compared to | ||
|---|---|---|---|
| May 2017 | last month (m-o-m) | 12 months before (y-o-y) | |
| Hyper and supermarkets (A) | 99.92 | 0.2 | 0.3 |
| Large and predominantly food stores (A + neighborhood stores) | 99.95 | 0.2 | 0.3 |
| Other stores | 101.98 | 0.2 | 1.4 |
| All stores | 100.29 | 0.2 | 0.4 |
- Geographical coverage: metropolitan France
- Source: INSEE - Consumer Price Indexes
tableauTable2 – Prices of frequently purchased goods detailed by main items
| Index | Changes (%) compared to | ||
|---|---|---|---|
| May 2017 | last month (m-o-m) | 12 months before (y-o-y) | |
| Food and beverages (excluding fresh foodstuffs) | 100.22 | 0.3 | 0.4 |
| - Meat | 101.03 | 0.5 | 0.6 |
| - Beverages | 100.38 | 0.2 | 0.6 |
| - Other food products | 99.73 | 0.2 | 0.2 |
| Clearing and personal care products | 98.44 | −0.2 | −0.4 |
| Total Hyper and supermarkets | 99.92 | 0.2 | 0.3 |
- Geographical coverage: metropolitan France
- Source: INSEE - Consumer Price Indexes
Acceleration in food prices in hyper and supermarkets
In May 2017, the prices of food excluding fresh products sold in hyper and supermarkets speeded up (+0.3% after +0.1% in the two previous months). Year on year, their increase was amplified to +0.4% after +0.2% in April.
The month-on-month acceleration resulted from a sharp rebound in meat prices and an increase in beverages prices, partly offset by a slight slowdown in food prices other than meat and beverages.
Meat prices rebounded sharply to +0.5% after a 0.1% downturn in the previous month. Year on year, they accelerated: they increased by 0.6% after +0.3% in April.
After a stability in April, the prices of beverages sold in hyper and supermarkets rose by 0.2%. Year on year, these prices increased by 0.6% for the second consecutive month.
The prices of other food products (excluding fresh food) slowed down a little in May (+0.2% after +0.3%). Year on year, they rose by 0.2% after a stability in April following 51 months of continuous decrease.
Further fall in the prices of cleaning and personal care products in hyper and supermarkets
In May, the prices of cleaning and personal care products sold in hyper and supermarkets dropped by 0.2%, as in the previous month. Year on year, they fell by 0.4% for the third consecutive month.
Pour en savoir plus
