


 28 April 2017
2017- n° 121In March 2017, the turnover grew in large-scale food retailing (+0.5%) Turnover in large-scale food retailing - March 2017
28 April 2017
2017- n° 121In March 2017, the turnover grew in large-scale food retailing (+0.5%) Turnover in large-scale food retailing - March 2017
In March 2017, the turnover in large-scale food retailing grew by 0.5% after near stability in February. The sales volume of non-food products accelerated markedly (+2.5% after +0.7%). It accelerated more moderately in food products (+0.7% after +0.4%). By contrast, sales of automotive fuels fell again (−0.7% after −3.6%). In March, sales in supermarkets levelled off, whereas they picked up in hypermarkets (+0.9%) after two months of near stability.
In March 2017, the turnover in large-scale food retailing grew by 0.5% after near stability in February. The sales volume of non-food products accelerated markedly (+2.5% after +0.7%). It accelerated more moderately in food products (+0.7% after +0.4%). By contrast, sales of automotive fuels fell again (−0.7% after −3.6%). In March, sales in supermarkets levelled off, whereas they picked up in hypermarkets (+0.9%) after two months of near stability.
Increase by 1.0% over the last three months
Over the last three months, the turnover in large-scale food retailing rose by 1.0% compared to the previous three months. Over that period, sales of automative fuel shot up (+8.6%) buoyed above all by the fuel price increase. Sales also went up in non-food products (+2.0%) while they decreased moderately in food products (−0.5%). The turnover grew more in supermarkets (+1.5%) than in hypermarkets (+0.6%).
Growth by 1.1% over a year
The turnover of the past three months in large-scale food retailing rose over a year (+1.1%). On the one hand, sales of automotive fuel surged (+18.6%), boosted by the upturn in fuel prices. On the other hand, the turnover in food products declined (−1.1%) and shrank even more in non-food products (−3.1%).
Year on year, sales increased more sharply for supermarkets (+2.3%) than for hypermarkets (+0.3%).
graphiqueGraph1 – Turnover in large-scale food retailing by type of retail stores
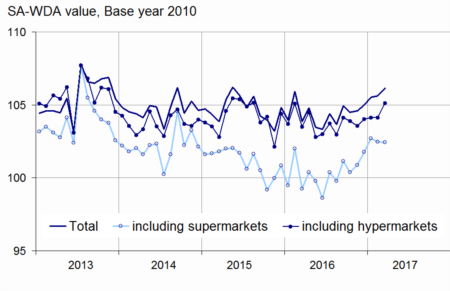
- Source: INSEE - Monthly survey of large-scale food retail activities (Emagsa)
graphiqueGraph2 – Turnover in super and hypermarkets by type of products
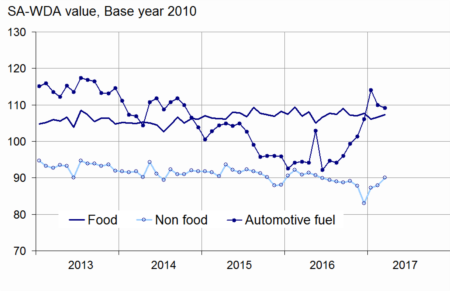
- Source: INSEE - Monthly survey of large-scale food retail activities (Emagsa)
graphiqueGraph3 – Turnover by type of retail stores and type of products
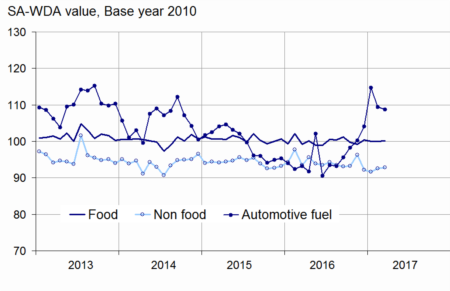
- Source: INSEE - Monthly survey of large-scale food retail activities (Emagsa)
graphiqueGraph4 – Turnover by type of retail stores and type of products
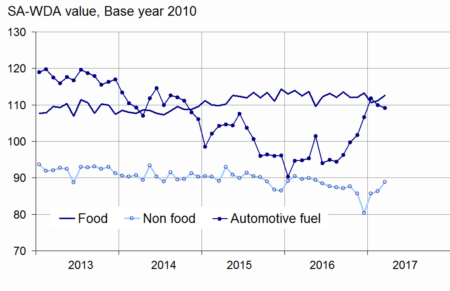
- Source: INSEE - Monthly survey of large-scale food retail activities (Emagsa)
tableauTable1 – Turnover in large-scale food retailing
| Variation en % | |||||
|---|---|---|---|---|---|
| Kind of stores or kind of products | Mar/ Feb. | Feb./ Jan. | Jan./ Dec. | q-o-q (1) | y-o-y (2) |
| Turnover (*) | 0.5 | 0.1 | 0.5 | 1.0 | 1.1 |
| including | |||||
| Sales of food products(**) | 0.7 | 0.4 | –1.4 | –0.5 | –1.1 |
| Sales of non-food products(**) | 2.5 | 0.7 | 5.2 | 2.0 | –3.1 |
| Sales of automotive fuel(**) | –0.7 | –3.6 | 7.5 | 8.6 | 18.6 |
| including | |||||
| Supermarkets(***) | 0.0 | –0.2 | 0.9 | 1.5 | 2.3 |
| Hypermarkets(***) | 0.9 | 0.0 | 0.1 | 0.6 | 0.3 |
- (1) Quarter-on-quarter: last three months / previous three months (2) Year-on-year: last three months / same three months of previous year
- (*) : including sales not in stores
- (**) : sold in supermarkets or hypermarkets
- (***) : excluding sales not in stores
- Source: INSEE - Monthly survey of large-scale food retailing activities (Emagsa)
tableauTable2 – Revisions of variations
| Feb./ Jan. | Jan./ Dec. | Dec./ Nov. | Q4 2016/ Q3 2016 | 2016/ 2015 | |
|---|---|---|---|---|---|
| Large-scale food retailing | 0,08 | 0,02 | 0,10 | 0,20 | 0,02 |
| Raw serie | –0,04 | 0,00 | 0,23 | 0,18 | 0,00 |
| SA-WDA parameters | 0,12 | 0,02 | –0,13 | 0,02 | 0,02 |
- How to read it: Within large scale food retailing, the SA-WDA variation between January and February 2017 is revised by 0.08 points.
- Source: INSEE - Monthly survey of large-scale food retailing activities (Emagsa)
Revisions
The variation in the turnover of large-scale food-retailing for February 2017 has been revised upwards by 0.1 points to +0.1% instead of 0.0% previously published. This revision is mainly due to the update of seasonal adjustement parameters.
Pour en savoir plus
