


 27 April 2017
2017- n° 113In March 2017, agricultural product prices kept rising sharply over one year Indices of agricultural prices - March 2017
27 April 2017
2017- n° 113In March 2017, agricultural product prices kept rising sharply over one year Indices of agricultural prices - March 2017
In March 2017, agricultural product prices increased by 5.9% over one year, less sharply than in February. Excluding fruits and vegetables, they declined by 0.6% over one month and went up by 7.2% over one year.
In March 2017, agricultural product prices increased by 5.9% over one year, less sharply than in February. Excluding fruits and vegetables, they declined by 0.6% over one month and went up by 7.2% over one year.
Downturn in cereal and oilseed prices
In March 2017, cereal prices retreated (−2.6%). The supply has been considered ample and the current weather conditions in the Northern hemisphere have helped crop development. Over one year, cereal prices have been rallying from the low levels they reached in the beginning of 2016 (+14.9% over one year in February). Likewise, oilseed prices fell back over the month (−2.9%) while they increased sharply over one year (+14.7%). The month-on-month drop was driven by the decrease in soy and palm oil prices whose supply has been significant, and to the simultaneous fall in petroleum product prices which made less attractive biodiesel, notably made from rape.
graphiqueGraph1 – Producer prices of cereals
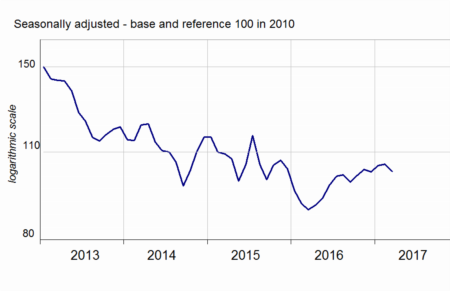
- Source: INSEE
Decrease in fresh vegetable prices but increase in fresh fruit and potato prices
In March 2017, fresh vegetable prices decreased year on year (−16.5% after +52.0%). The return to milder temperatures in March accelerated the growth of vegetables like lamb's lettuce and lettuce while the consumers tended to turn aside from cauliflowers. By contrast, fresh fruit prices remained dynamic (+6.0% yoy). Because of the weak yields in North-Western Europe during the last production campaign, potato prices strongly increased over one year (+36.2%). Wine prices declined by 1.0% over one year reflecting the fall (−6,9%) in prices of wines without protected designation of origin (“other wines”), which underwent Spanish competition.
graphiqueGraph2 – Producer prices of fresh vegetables
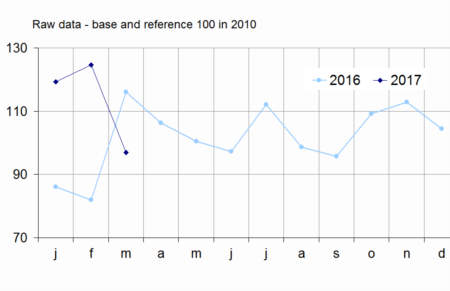
- Source: SSP (ministry in charge of agriculture)
Rise in animals and milk prices
Over one year, animal prices kept on increasing sharply (+4.3% after +3.8%) reflecting pig prices dynamism (+25.1%), buoyed by Chinese demand. Large cattle prices sligntly went up (+0.7%) while the prices of others animals declined.
graphiqueGraph3 – Producer prices of pigs and large cattle
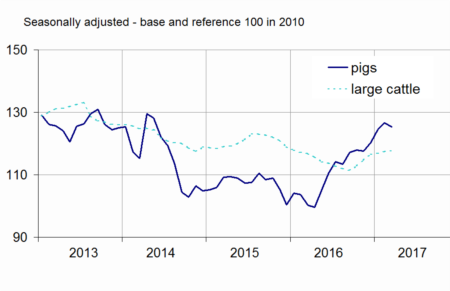
- Source: INSEE
Cow milk price rose again (+4.7% from December to February) : global milk collection has been decreasing since mid-2016 while butter and cheese exportations were dynamic, mainly towards the United States and Asia.
tableautable1 – Indice of producer prices of agricultural products (IPPAP)
| Variation as % over | |||||
|---|---|---|---|---|---|
| Weights | March 2017 | a month | 3 months | a year | |
| Agricultural goods output | 1000 | 117.2 | /// | /// | +5.9 |
| excluding fruits and vegetables | 900 | 118.4 | –0.6 | –0.1 | +7.2 |
| Crop output (excluding fruits and vegetables) | 505 | 122.1 | –1.2 | –1.1 | +8.1 |
| Cereals | 188 | 102.6 | –2.6 | +0.2 | +14.9 |
| of which soft wheat | 112 | 100.8 | –2.8 | +1.3 | +19.4 |
| grain maize | 41 | 102.1 | –1.2 | +1.9 | +16.2 |
| Potatoes | 26 | 252.1 | /// | /// | +36.2 |
| Wines | 177 | 132.2 | –0.2 | –2.4 | –1.0 |
| protected designation of origin | 84 | 142.3 | –0.4 | –3.9 | –0.3 |
| other wines | 23 | 135.0 | –0.5 | –2.5 | –6.9 |
| Oleaginous | 49 | 107.8 | –2.9 | –1.6 | +14.7 |
| Horticultural products | 30 | 107.3 | –0.5 | –3.9 | –5.4 |
| Other crop products | 36 | 112.5 | –0.5 | +1.9 | +3.5 |
| Fruits and vegetables (1) | 100 | 105.8 | /// | /// | –7.4 |
| Fresh vegetables | 53 | 96.9 | /// | /// | –16.5 |
| Fresh fruits | 35 | 117.4 | /// | /// | +6.0 |
| Animal output | 395 | 113.7 | +0.3 | +1.3 | +6.2 |
| Animals | 234 | 116.1 | –0.3 | +1.1 | +4.3 |
| of which large cattle | 96 | 117.6 | +0.1 | +0.9 | +0.7 |
| calves | 26 | 109.7 | –0.6 | +1.7 | –3.6 |
| pigs | 54 | 125.4 | –0.9 | +4.2 | +25.1 |
| sheep | 10 | 105.2 | –1.3 | –9.8 | –9.7 |
| poultry | 46 | 108.6 | –0.3 | –0.4 | –1.8 |
| of which chicken | 28 | 108.1 | –0.5 | –0.7 | –1.8 |
| Milk | 147 | 107.2 | /// | +4.4 | +8.8 |
| of which cow milk (2) | 137 | 106.8 | /// | +4.7 | +9.4 |
| Eggs | 15 | 142.1 | +11.5 | –13.4 | +13.4 |
- * Except for fresh fruits, fresh vegetables and potatoes
- /// Absence of result due to the nature of these series
- (1) Including vegetables for industry.
- (2)The February value of cow milk price indice is carried forward in March
- Sources: INSEE, SSP (ministry in charge of agriculture)
Purchase prices of means of production were virtually stable over the month
In March 2017, intermediate consumption prices slightly decreased over one month (−0.2%) but rose over one year (+1.2%). These moves reflected mainly the energy prices variations (−2.4% over one month; +14.9% yoy). On the other hand, fertilisers prices still decreased markedly over one year (−5.9%). Capital goods prices rose a little more than in February (+0.3% after +0.2%; +1.5% yoy).
Revisions
The changes in IPPAP and IPAMPA over one year in February 2017 have been raised by 0.1 points each for the seasonally adjusted data.
graphiqueGraph4 – Purchase prices of the means of agricultural production
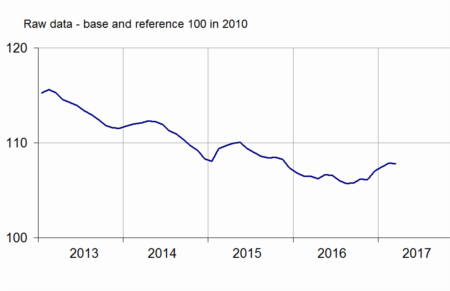
- Sources: INSEE, SSP (ministry in charge of agriculture)
tableautable2 – Indices of purchase prices of the means of agricultural production (IPAMPA)
| Weights | March 2017 | variation as % over | |||
|---|---|---|---|---|---|
| a month | 3 months | a year | |||
| Total input | 1000 | 107.8 | –0.1 | +0.7 | +1.2 |
| Intermediate consumptions | 764 | 107.7 | –0.2 | +0.8 | +1.2 |
| Energy | 100 | 100.0 | –2.4 | –2.0 | +14.9 |
| Seeds | 57 | 106.5 | +0.1 | 0.0 | –1.7 |
| Fertilisers and soil improvers | 92 | 106.2 | +0.4 | +5.3 | –5.9 |
| Plant protection products | 78 | 97.8 | +0.3 | –0.3 | –0.6 |
| Animal feed | 205 | 113.8 | +0.3 | +1.5 | +1.2 |
| Veterinary expenses | 43 | 119.3 | +0.2 | +0.5 | +2.1 |
| Small equipment and tools | 17 | 106.7 | –0.4 | –1.3 | –1.4 |
| Maintenance of materials | 67 | 115.0 | +0.1 | +1.0 | +1.5 |
| Maintenance of buildings | 9 | 108.1 | 0.0 | +0.4 | +2.2 |
| Other goods and services | 97 | 102.7 | 0.0 | +0.1 | –0.5 |
| Goods and services contributing to investment | 236 | 108.2 | +0.3 | +0.3 | +1.5 |
| Material | 186 | 109.5 | +0.4 | +0.3 | +1.3 |
| Tractors | 79 | 110.4 | +0.5 | +0.7 | +1.9 |
| Machinery and equipment for cultivation | 36 | 111.1 | +0.8 | +0.3 | +0.5 |
| Machinery and equipment for harvesting | 42 | 109.5 | –0.2 | –0.4 | +1.2 |
| Utility vehicles | 18 | 104.3 | +0.3 | –0.8 | +0.1 |
| Buildings | 50 | 103.6 | 0.0 | +0.5 | +2.9 |
- (1) The repayment of the domestic tax on energy product (TICPE) benefiting farmers has been applied in advance for the year 2017
- Sources: INSEE, SSP (ministry in charge of agriculture)
Documentation
Methodology (pdf,122 Ko)
Pour en savoir plus
Time series : Indices of agricultural prices
