


 31 March 2017
2017- n° 92In February 2017, the turnover in large-scale food retailing was stable Turnover in large-scale food retailing - February 2017
31 March 2017
2017- n° 92In February 2017, the turnover in large-scale food retailing was stable Turnover in large-scale food retailing - February 2017
In February 2017, the turnover in large-scale food retailing was stable after an increase by 0.5% in January. Sales of automotive fuels fell back strongly (−3.6%) after two consecutive months of brisk rises (incl. +7.6% in January). However, sales of food products rebounded slightly (+0.5% after −1.4%) and the turnover for non-food products kept on increasing yet (+0.5% après +4.6%).
Over that period, sales in supermarkets flattened out after two consecutive months of rise (incl. +0.9% in January). They remained steady in hypermarkets, like in January.
Moderate increase over the last three months
Over the last three months, the turnover in large-scale food retailing rose moderately (+0.5%).
Sales of automative fuel shot up significantly (+11.5%) buoyed above all by the price increase of fuel. Conversely, they declined for food products (−1.2%) and even more sharply for non-food products (−2.7%). The turnover grew more markedly in supermarkets (+1.4%) than in hypermarkets (+0.2%).
Slight increase over a year (+0.3 %)
The turnover of the past three months in large-scale food retailing grew slightly (+0.3%) over a year. On the one hand, sales of automative fuel surged (+17.0%). On the other hand, the turnover of food products (−1.4%) declined and even more that of non-food products (−4.3%).
Year on year, sales increased for supermarkets (+1.5%) while they declined slightly for hypermarkets (−0.2%).
graphiqueGraph1 – Turnover in large-scale food retailing by type of retail stores

- Source: INSEE - Monthly survey of large-scale food retail activities (Emagsa)
graphiqueGraph2 – Turnover in super. and hypermarkets by type of products
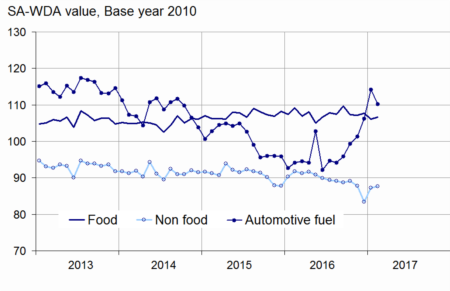
- Source: INSEE - Monthly survey of large-scale food retail activities (Emagsa)
graphiqueGraph3 – Turnover by type of retail stores and type of products
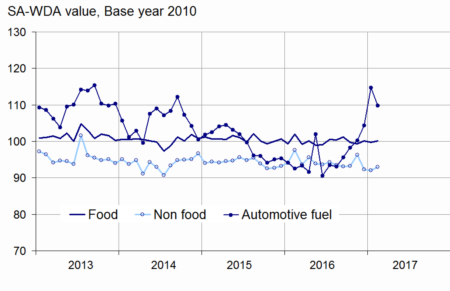
- Source: INSEE - Monthly survey of large-scale food retail activities (Emagsa)
graphiqueGraph4 – Turnover in hypermarkets by type of products

- Source: INSEE - Monthly survey of large-scale food retail activities (Emagsa)
tableauTable1 – Turnover in large-scale food retailing
| Variation en % | |||||
|---|---|---|---|---|---|
| Kind of stores or kind of products | Feb./Jan. | Jan./ Dec. | Dec./ Nov. | q-o-q (1) | y-o-y (2) |
| Turnover(*) | 0.0 | 0.5 | 0.3 | 0.5 | 0.3 |
| including | |||||
| Sales of food products(**) | 0.5 | –1.4 | 0.4 | –1.2 | –1.4 |
| Sales of non-food products(**) | 0.5 | 4.6 | –4.9 | –2.7 | –4.3 |
| Sales of automotive fuel(**) | –3.6 | 7.6 | 4.9 | 11.5 | 17.0 |
| including | |||||
| Supermarkets(***) | 0.0 | 0.9 | 0.7 | 1.4 | 1.5 |
| Hypermarkets(***) | –0.1 | 0.1 | 0.5 | 0.2 | –0.2 |
- (1) Quarter-on-quarter: last three months / previous three months (2) Year-on-year: last three months / same three months of previous year
- (*): including sales not in stores
- (**): sold in supermarkets or hypermarkets
- (***): excluding sales not in stores
- Source: INSEE - Monthly survey of large-scale food retailing activities (Emagsa)
tableauTable2 – Revisions of variations
| Jan./ Dec. | Dec./ Nov. | Nov./ Oct. | Q4 2016/ Q3 2016 | 2016/ 2015 | |
|---|---|---|---|---|---|
| Large-scale food retailing | 0.17 | 0.00 | 0.01 | –0.01 | 0.00 |
| raw serie | 0.19 | 0.02 | 0.00 | 0.00 | 0.00 |
| SA-WDA parameters | –0.02 | –0.02 | 0.01 | –0.01 | 0.00 |
- How to read it: within large scale food retailing, the SA-WDA variation between December 2016 and January 2017 is revised by +0.17 points mostly due to the new calculation of SA-WDA parameters.
- Source: INSEE - Monthly survey of large-scale food retailing activities (Emagsa)
Revisions
The variation for December 2016 has been raised by 0.2 points to +0.5% instead of +0.3% calculated previously.
Pour en savoir plus
