


 3 April 2017
2017- n° 45The rise in the prices of second-hand dwellings continued in Q4 2016 Notaries-INSEE second-hand dwellings price index - fourth quarter 2016
3 April 2017
2017- n° 45The rise in the prices of second-hand dwellings continued in Q4 2016 Notaries-INSEE second-hand dwellings price index - fourth quarter 2016
3 April 2017: The file of additional data has been updated compared to the publication of 23 February 2017.
In Q4 2016, the prices of second-hand dwellings kept increasing: +0.7% compared to the previous quarter (provisional seasonally adjusted results). This quarter, the increase was mostly due to the prices of flats (+0.9%). The prices of houses increased in a more moderate way (+0.5%).
Over a year, the increase in prices strengthened: +1.8% compared to Q4 2015, after +1.3% the quarter before. This increase was roughly the same for flats (+1.9%) and for houses (+1.7%).
In Île-de-France, the rise in the prices of second-hand dwellings intensified
In Q4 2016, the prices of second-hand dwellings in Île-de-France continued to rise: +0.9% compared to Q3 2016, after +0.7%.
Year-on-year, the rise of prices became more significant: +3.1% compared to Q4 2015, after +2.0 and +1.5%. In Île-de-France, the rise was mainly buoyed by the prices of flats (+3.5%), especially for the flats in Paris which increased by 4.4% over a year. The prices of houses in Île-de-France also increased, albeit less markedly (+2.3% over the year).
In provincial France, prices rose in a more moderate way than in Île-de-France
In provincial France, the prices of second-hand dwelling rose by 0.6% between the third and the fourth quarter of 2016, that is in a more moderate way than in Île-de-France. Prices remained higher than one year before (+1.3%). Unlike in Île-de-France, the rise was mainly driven by the prices of houses, which increased by 1.6% between the end of 2015 and the end of 2016; the prices of flats increased by 0.6%.
graphiqueGraphique1a – Variation in prices of second-hand dwellings in metropolitan France over a year
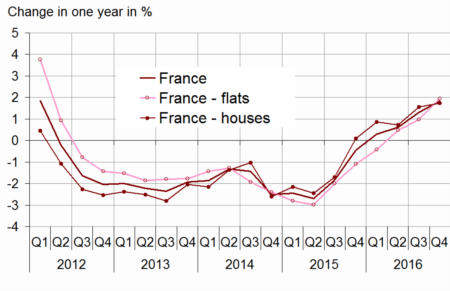
- Sources: INSEE, French notaries - Database Bien, Perval society
graphiqueGraphique2a – Prices of second-hand dwellings in Île-de-France
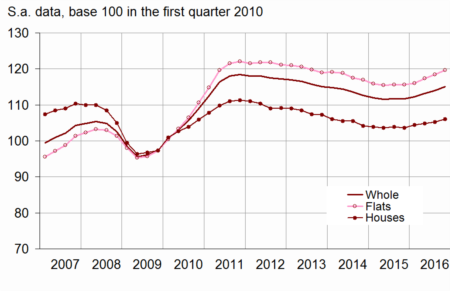
- Scope: Île-de-France
- Sources: INSEE, French notaries - Database Bien, Perval society
tableauTableau1a – Variation in prices of second-hand dwellings in metropolitan France
| change in | ||||||
|---|---|---|---|---|---|---|
| 3 months (S.A.) | 12 months | |||||
| 2016 Q2 | 2016 Q3 (sd) | 2016 Q4 (p) | 2016 Q2 | 2016 Q3 (sd) | 2016 Q4 (p) | |
| France | -0.1 | 0.8 | 0.7 | 0.6 | 1.3 | 1.8 |
| Flats | 0.4 | 0.5 | 0.9 | 0.5 | 1.0 | 1.9 |
| Houses | -0.4 | 1.0 | 0.5 | 0.7 | 1.6 | 1.7 |
- (p): provisional; (sd): semi-definitive
- Scope: Metropolitan France
- Sources: INSEE, French notaries - Database Bien, Perval society
The annual volume of transactions reached a record high
At the end of 2016, the annual transaction volume continued to grow: in December, the number of transactions carried out over the last twelve months reached the historical level of 848,000. It even exceeded the previous peak level hit in May 2006 (837,000). This level has been reached in a context of trend growth in the number of existing dwellings (around +1% on average per year for 30 years).
graphiqueGraphique3a – Volume of transactions of second-hand dwellings over the last 12 months
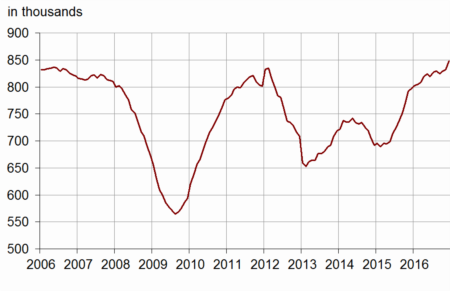
- Scope: France excluding Mayotte
- Sources: CGEDD, based on notarial databases and DGFiP (MEDOC)
Revisions
The second-hand housing price index is revised to include transactions recorded after the previous publication.
In comparison with the results released on 3 January 2017, the change in prices in Q3 2016 has been revised downwards by −0.3 points overall, for houses as for flats. The overall change in prices in Q3 2016 stands at +0.8%, instead of +1.1% (figure published on 3 January) and +1.2% estimated on 24 November 2016.

Erratum of 2 May 2017: the scope of the volume of transactions is France excluding Mayotte, and not Metropolitan France as stated previously under the associated graph.
tableauTableau2a – Variation in prices of second-hand dwellings in metropolitan France
| Change in | ||||||
|---|---|---|---|---|---|---|
| 3 months (S.A.) | 12 months | |||||
| 2016 Q2 | 2016 Q3 (sd) | 2016 Q4 (p) | 2016 Q2 | 2016 Q3 (sd) | 2016 Q4 (p) | |
| Metropolitan France | -0.1 | 0.8 | 0.7 | 0.6 | 1.3 | 1.8 |
| - Flats | 0.4 | 0.5 | 0.9 | 0.5 | 1.0 | 1.9 |
| - Houses | -0.4 | 1.0 | 0.5 | 0.7 | 1.6 | 1.7 |
| Île-de-France | 0.9 | 0.7 | 0.9 | 1.5 | 2.0 | 3.1 |
| Provincial France | -0.5 | 0.8 | 0.6 | 0.2 | 1.0 | 1.3 |
| Flats | ||||||
| Île-de-France | 1.1 | 0.9 | 1.0 | 1.6 | 2.3 | 3.5 |
| - Paris | 1.5 | 1.1 | 1.4 | 3.0 | 3.6 | 4.4 |
| - Seine-et-Marne | 0.1 | 1.1 | 1.0 | -1.7 | -0.1 | 1.1 |
| - Yvelines | 0.8 | 0.2 | 0.9 | 0.5 | 0.7 | 2.8 |
| - Essonne | 0.1 | 0.8 | 0.7 | -0.7 | 0.3 | 1.0 |
| - Hauts-de-Seine | 1.1 | 0.8 | 0.4 | 1.0 | 2.0 | 3.4 |
| - Seine-Saint-Denis | 0.6 | 0.8 | 0.1 | 0.1 | 1.2 | 1.8 |
| - Val-de-Marne | 1.0 | 0.8 | 1.0 | 0.7 | 1.7 | 3.1 |
| - Val-d'Oise | 0.2 | 0.6 | 1.6 | -0.6 | 0.6 | 2.4 |
| Provincial France | -0.3 | 0.1 | 0.9 | -0.5 | -0.2 | 0.6 |
| - Conurbation > 10 000 inhabitants | -0.4 | 0.2 | ** | -0.5 | -0.2 | ** |
| - Central town | -0.3 | 0.3 | ** | -0.3 | 0.1 | ** |
| - Suburb | -0.6 | -0.1 | ** | -0.7 | -0.6 | ** |
| - Conurbation < 10 000 inhabitants | 0.7 | -0.1 | ** | -0.6 | -0.9 | ** |
| Houses | ||||||
| Île-de-France | 0.4 | 0.3 | 0.8 | 1.2 | 1.3 | 2.3 |
| - Seine-et-Marne | 0.3 | 0.5 | 0.5 | 0.6 | 1.2 | 1.6 |
| - Yvelines | 0.1 | 0.6 | 1.0 | 0.7 | 1.2 | 2.7 |
| - Essonne | 0.9 | 0.2 | 0.7 | 1.2 | 1.2 | 2.0 |
| - Hauts-de-Seine | -0.8 | -0.5 | 1.9 | 1.5 | 0.2 | 4.1 |
| - Seine-Saint-Denis | 1.4 | 0.3 | 0.6 | 2.7 | 1.8 | 1.5 |
| - Val-de-Marne | 0.9 | 0.0 | 0.7 | 2.0 | 1.5 | 2.3 |
| - Val-d'Oise | 0.8 | 0.9 | 0.0 | 1.1 | 2.0 | 1.5 |
| Provincial France | -0.6 | 1.2 | 0.5 | 0.6 | 1.6 | 1.6 |
| Nord-Pas de Calais | -0.2 | 1.0 | ** | 1.0 | 1.0 | ** |
| - Flats | -0.5 | -0.2 | ** | -1.9 | -1.1 | ** |
| - Houses | -0.1 | 1.2 | ** | 1.6 | 1.3 | ** |
| - Lille Houses | 1.1 | 1.4 | ** | 3.3 | 1.2 | ** |
| Provence-Alpes-Côte d'Azur | -2.2 | 1.4 | ** | -1.5 | 0.4 | ** |
| - Flats | -0.4 | 0.0 | ** | -1.3 | -0.8 | ** |
| - Houses | -4.0 | 2.8 | ** | -1.7 | 1.7 | ** |
| - Marseille Flats | 1.7 | 1.3 | ** | -2.6 | -0.8 | ** |
| Rhône-Alpes | 0.1 | 0.8 | ** | 1.5 | 2.0 | ** |
| - Flats | -0.2 | 0.7 | ** | 0.4 | 1.1 | ** |
| - Houses | 0.5 | 1.0 | ** | 2.6 | 2.9 | ** |
| - Lyon Flats | 0.6 | 1.0 | ** | 3.5 | 2.9 | ** |
- ** index released on 3 April 2017.
- (p): provisional ; (sd): semi-definitive
- Sources: INSEE, French notaries - Database Bien, Perval society
Pour en savoir plus
