


 21 February 2017
2017- n° 42In January 2017, consumer prices decreased by 0,2%; they rose by 1.3% year on year Consumer price index - final results - January 2017
21 February 2017
2017- n° 42In January 2017, consumer prices decreased by 0,2%; they rose by 1.3% year on year Consumer price index - final results - January 2017
In January 2017, the Consumer Prices Index (CPI) declined by 0.2% over a month after an increase by 0.3% in December. Seasonally adjusted, it grew by 0.7%, after +0.1% in December. Year on year, the CPI accelerated sharply (+1.3% after +0.6%). Inflation has reached its highest level since November 2012.
Monthly change: −0.2%; Year-on-year change: +1.3%
In January 2017, the Consumer Prices Index (CPI) declined by 0.2% over a month after an increase by 0.3% in December. Seasonally adjusted, it grew by 0.7%, after +0.1% in December. Year on year, the CPI accelerated sharply (+1.3% after +0.6%). Inflation has reached its highest level since November 2012.
Over one month, the fall was due to the seasonal decline in manufactured product prices, essentially those of clothing and footwear. However, this decrease was less strong than in January 2016, mainly because winter sales started later this year. The overall drop was mitigated by the sharp acceleration in energy prices and, to a lesser extent, in food prices.
Sharp acceleration in energy prices
In January 2017, energy prices sped up strongly (+4.5%) after already four consecutive months of increase. Year on year, they strenghtened sharply (+10.3% after +4.3% in the previous month). It has been the strongest rise since November 2011.
This dynamism resulted mainly from a drastic rise in petroleum products prices (+7.5%; +19.9% year on year), due to a rebond in Brent crude and to higher taxation of energy products. Natural gas and city gas prices accelerated sharply too (+5.0% after +2.4%). Year on year, they went up for the first time since September 2015 (+1.6% after −2.2%). By contrast, electricity prices have been unchanged since September 2016 (−0.3% year on year).
tableauTable1 – Detailed figures for various groups
| Items | Weight | Index | Percentage change | |
|---|---|---|---|---|
| 2017 | Jan. 2017 | m-on-m change | y-on-y change | |
| a) All households | ||||
| Overall | 10000 | 100.41 | −0.2 | 1.3 |
| Overall SA* | 10000 | 101.26 | 0.7 | 1.4 |
| Food | 1627 | 101.20 | 0.4 | 1.3 |
| Fresh food | 235 | 107.62 | 2.8 | 9.0 |
| Other food | 1392 | 100.18 | 0.1 | 0.1 |
| Tobacco | 188 | 100.17 | 0.0 | 0.1 |
| Manufactured products | 2617 | 97.51 | −2.4 | −0.3 |
| Clothing and footwear | 433 | 92.22 | −12.4 | 5.1 |
| Medical products | 433 | 95.87 | −0.1 | −2.5 |
| Other manufactured products | 1751 | 99.13 | −0.4 | −0.7 |
| Energy | 748 | 104.80 | 4.5 | 10.3 |
| Petroleum products | 378 | 107.15 | 7.5 | 19.9 |
| Services | 4820 | 101.07 | −0.1 | 0.9 |
| Actual rentals and services for dwellings | 779 | 100.87 | 0.0 | 0.3 |
| Health services | 600 | 100.41 | 0.2 | 0.3 |
| Transport | 282 | 97.36 | −3.5 | 1.2 |
| Communication | 242 | 98.94 | −3.4 | −1.1 |
| Other services | 2917 | 101.79 | 0.4 | 1.3 |
| Total except rents and tobacco | 9183 | 100.41 | −0.3 | 1.4 |
| Total except tobacco | 9812 | 100.41 | −0.2 | 1.4 |
| b) Urban working-class households or households of employees | ||||
| All products excluding tobacco | 9710 | 100.29 | −0.3 | 1.3 |
| c) Households that belong to the lowest equivalized disposable income quintile - France | ||||
| All products excluding tobacco | 9705 | 100.19 | −0.4 | 1.4 |
- *: seasonally adjusted
- Geographical coverage: France excluding Mayotte
- Source: INSEE - Consumer Price Indices
Drop in manufactured goods prices
In January 2017, the manufactured product prices declined seasonally (−2.4%), but less sharply than in January 2016 (−3.0%), notably because the winter sales began later this year. Year on year, the decline in prices eased (−0.3% after −1.0% in December). Over a month, clothing and footwear prices fell steeply (−12.4%). The winter sales contributed more moderately to the decrease in prices of many other products: household textiles (−5.2%; +0.8% year on year), equipment for sport (−3.1%; −1.6% year on year), and furniture and furnishings (−2.1%; −0.5% year on year).
Stronger rise in food prices
In January 2017, food prices rose further (+0.4% after +0.1% in November and December). This increase was mainly due to a clear acceleration in fresh food prices (+2.8% after +0.9%). Excluding fresh products, food prices went up slightly (+0.1%), over a month as year on year.
Slight seasonal fall in service prices
In January 2017, the prices of services edged down slightly over one month (−0.1% after +0.4%); year on year they rose by 0.9%, as in the previous month. After the end-of-year holidays, tourism-related service prices fell back seasonally in January, particularly airfares (−11.8%; +0.7% year on year). Prices in communication services also diminished (−3.9%; −1.4% year on year) with the decrease in some packages prices. Conversely, as every year, many fees rose in January, in particular postal rates (+3.8%). Insurance fares also grew (+1.1%; +1.3% year-on-year), as the “tax attack” levied on insurance contracts has been raised.
Rebound in core inflation
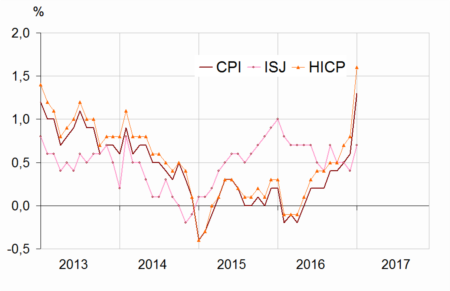
In January 2017, the core inflation indicator (ISJ) picked up to +0.4% after a drop by 0.1% in December. Year-on-year, it gathered pace to +0.7% after +0.4% in the previous month. The Harmonised Index of Consumer Prices (HICP) fell back by 0.3% over one month; year-on-year, it accelerated sharply: +1.6% after +0.8% in December.
graphiqueGraph1 – Consumer Price Index (CPI), core inflation (ISJ)* and Harmonised Index of Consumer Prices (HICP)** year-on-year changes
tableauTable2 – Detailed figures for Core inflation* and HICP**
| Items | Weight | Index | Percentage change | |
|---|---|---|---|---|
| 2017 | Jan. 2017 | m-on-m change | y-on-y change | |
| Core inflation - All items | 6134 | 101.02 | 0.4 | 0.7 |
| Food excluding fresh products, meat, milk and exotic products | 744 | 100.38 | 0.2 | 0.3 |
| Manufactured products | 2136 | 100.27 | 0.7 | 0.2 |
| Services including actual rentals and services for dwellings | 3254 | 101.81 | 0.3 | 1.0 |
| HICP - All items | 100.57 | −0.3 | 1.6 | |
- * Core inflation indicator excludes public sector prices, the most volatile consumer prices and the tax measures. Seasonally adjusted, this index is calculated for all households in France excluding overseas departments and territories. (in French “indice d'inflation sous-jacent - ISJ”)
- **HICP: Harmonised Indices of Consumer Prices are inflation figures designed for international comparison between Member states of the European Union. This index is calculated for all households in France excluding Mayotte.
- Source: INSEE - Consumer Price Indices
Revisions
Compared to the provisional estimates published on 31 January 2017, the year-on-year rate of change in the CPI in January 2017 has been lowered by 0.1 points, whereas its month-on-month rate is unchanged. For the HICP, the monthly change is lowered by 0.1 points and the year-on-year change is confirmed.
Documentation
Methodology (pdf,141 Ko)
The Consumer Price Indice: changes for 2017 (pdf,413 Ko)
Pour en savoir plus
