


 14 February 2017
2017- n° 40In November 2016, producer costs for construction rose slightly (+0.2%) Costs of production indices in construction - November 2016
14 February 2017
2017- n° 40In November 2016, producer costs for construction rose slightly (+0.2%) Costs of production indices in construction - November 2016
In November 2016, producer costs for construction increased slighlty (+0.2%) after a two-month near stability. They continued to grow in civil engineering (+0.5% after +0.4%). They were virtually stable in specialised construction works (+0.1% as in the past two months) and in building construction (+0.1% after 0.0%). Over a year, producer costs rose in the entire construction sector (+1.4 % as in the previous month). They were a little less dynamic in building construction (+1.2% as in October) and in the specialised construction works (+1.3% after +1.5%) than in civil engineering, in which they accelerated (+1.8% after +1.2%).
In November 2016, producer costs for construction increased slighlty (+0.2%) after a two-month near stability. They continued to grow in civil engineering (+0.5% after +0.4%). They were virtually stable in specialised construction works (+0.1% as in the past two months) and in building construction (+0.1% after 0.0%). Over a year, producer costs rose in the entire construction sector (+1.4 % as in the previous month). They were a little less dynamic in building construction (+1.2% as in October) and in the specialised construction works (+1.3% after +1.5%) than in civil engineering, in which they accelerated (+1.8% after +1.2%).
tableauTable1 – Variations in producer cost indices for construction
| NAF | Heading | Weights (in %) | Nov 16/ Oct 16 | Nov 16/ Nov 15 |
|---|---|---|---|---|
| F | Construction | 100.0 | +0.2 | +1.4 |
| 41.2 | Construction of buildings | 10.1 | +0.1 | +1.2 |
| 42 | Civil engineering | 16.2 | +0.5 | +1.8 |
| 43 | Specialised construction works | 73.7 | +0.1 | +1.3 |
| 43BT | Buildings | 64.2 | +0.1 | +1.3 |
| 43BTC | New buildings | 24.6 | +0.1 | +1.1 |
| 43BTR | Existing buildings | 39.6 | 0.0 | +1.4 |
| 43TP | Specialised works for civil engineering | 9.5 | +0.3 | +1.8 |
| BT | Buildings (41.2 + 43BT) | 74.3 | 0.0 | +1.2 |
| TP | Public works (42 + 43TP) | 25.7 | +0.4 | +1.8 |
- Source: INSEE
tableauTable2 – Items of producer cost indices for construction
| Costs | items | Q3 16 / Q2 16 | Nov 16/ Oct 16 | Nov 16/ Nov 15 | |
|---|---|---|---|---|---|
| Equipment | Buildings | -0.4 | -0.2 | -2.4 | |
| Public works | -0.2 | +0.2 | +0.2 | ||
| Labour | Labour costs in construction | +1.0 | /// | /// | |
| Energy | Buildings | +0.5 | +1.3 | +5.2 | |
| Public works | +0.9 | +0.4 | +5.0 | ||
| Materials | Construction of buildings | +1.4 | 0.0 | -0.6 | |
| Existing buildings | +0.6 | 0.0 | -0.5 | ||
| Civil engineering | +3.5 | +1.1 | +1.5 | ||
| Specialised works for civil engineering | +0.3 | -0.2 | -0.9 | ||
| Services | Construction | +0.9 | -0.5 | +0.6 | |
| Transport | Buildings | 0.0 | +0.4 | +1.3 | |
| Public works | -0.3 | 0.0 | +0.4 | ||
- ///: non published estimation
- Source: INSEE
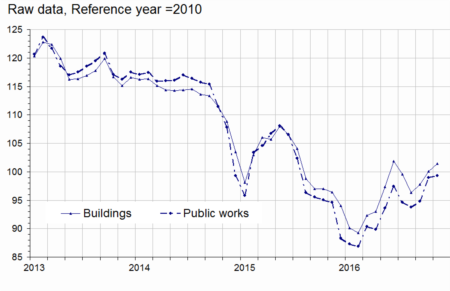
graphiqueGraph1 – Production costs in construction
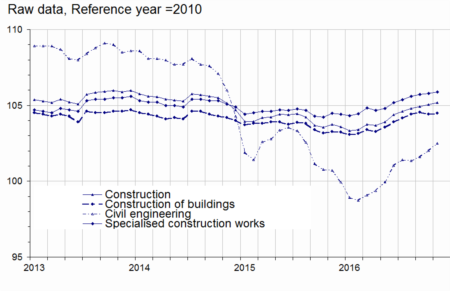
- Source: INSEE
Materials cost accelerated in civil engineering
In November 2016, materials cost accelerated in civil engineering (+1.1% after +0.3%) due to a stronger rise in bitumen prices. It was stable in building construction as well as in the renovation of existing buildings after a decrease in October. Materials cost continued to decline slightly in specialised works for civil engineering (−0.2% as in October).
Over a year, materials cost rose in civil engineering (+1.5 %). However, it remained lower than a year before in building construction (−0.6%) as well as in renovation of existing buildings (−0.5%) and in specialised works for civil engineering (−0.9%).
graphiqueGraph2 – Materials cost
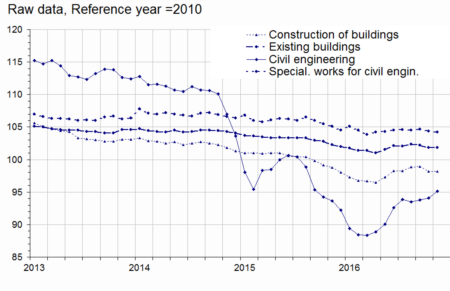
- Source: INSEE
Equipment cost decreased sligthly in building construction and increased slightly in public works
In November 2016, equipment cost declined slighlty in building construction (−0.2% after +0.5%); it decreased by 2.4% yoy. In public works, it rose moderately over a month (+0.2% after +0.1% in October) as well as over a year (+0.2% after −0.3%).
graphiqueGraph3 – Equipment cost
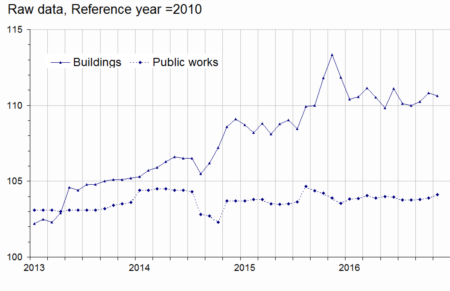
- Source: INSEE
graphiqueGraph4 – Labour cost in construction
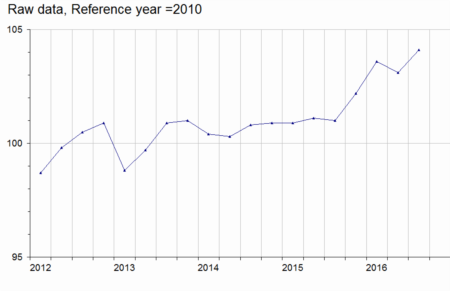
- Source: INSEE
Energy cost increased again
In November 2016, the cost of energy rose in building construction (+1.3% after +2.4%) and to a lesser extent in public works (+0.4% after +4.3%).
Over a year, the cost of energy accelerated in building construction (+5.2% after +3.2%) and in public works (+5.0% after +4.1%).
graphiqueGraph5 – Energy cost
- Source: INSEE
tableauTable3 – Variations' revisions
| August 16 | Sept. 16 | Oct. 16 | ||
|---|---|---|---|---|
| F | Construction | /// | /// | /// |
| 41.2 | Construction of buildings | /// | /// | /// |
| 42 | Civil engineering | /// | /// | /// |
| 43 | Specialised construction works | /// | /// | /// |
- ///: unchanged
- How to read it: the variation in producer cost for construction in October 2016 has not been revised, it remained at +0.1% as published in January 2017.
- Source: INSEE

Warning :
Monthly production cost indices in construction will be released on a quarterly basis after the next publication which will be in March 17, 2017. The next issue will take place in June 2017 and will present the results of Q1 2017.
Pour en savoir plus
Time series : Producer cost indices for construction
