


 27 January 2017
2017- n° 26In Decembre 2016, overall agricultural producer prices increased by 5.0% over one
year Indices of agricultural prices - December 2016
27 January 2017
2017- n° 26In Decembre 2016, overall agricultural producer prices increased by 5.0% over one
year Indices of agricultural prices - December 2016
In Decembre 2016, overall agricultural prices increased again compared to last year (+5.0%), faster than in the previous month (+3.0%). Excluding fruits and vegetables, they went up by 1.0% over the month and by 3.8% over one year.
In Decembre 2016, overall agricultural prices increased again compared to last year (+5.0%), faster than in the previous month (+3.0%). Excluding fruits and vegetables, they went up by 1.0% over the month and by 3.8% over one year.
Downturn in cereal prices but strong rise in oleaginous prices
In December, cereal prices fell back (−1.0 %) due to the abundant supply, backed by record crops of wheat in the Southern hemisphere, noticeably in Australia. For the exporters in the euro zone, the drop in wheat prices was mitigated by the appreciation of the dollar. Oleaginous prices kept on growing at a high pace (+8.6 % over three months), as the rise in oil price bolstered the attractivity of vegetal oils as substitute for hydrocarbons. The appreciation of dollar against euro also took part in this upward momentum.
graphiqueGraph1 – Producer prices of cereals
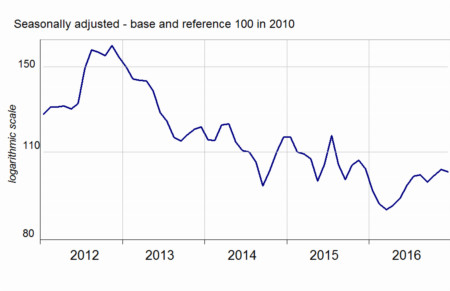
- Source: INSEE
Sharp year-on-year price rise for potatoes, wines, fruits and vegetables
In December, potato prices strongly rose over one year (+43.0%): adverse climatic condictions reduced the yields in North-Western Europe.
Wine prices went up (+3.6% over one year), in particular those for protected designation of origin wines (+7.7%) which harvests were affected by climatic hazards.
Fresh fruit prices remained dynamic over one year in December (+8.1%), as the crops of apples and pears retreated markedly. Fresh vegetables prices surged over one year (+35.1%). Lamb's lettuce price almost tripled : very mild weather had encouraged over-production at end-2015. Endive and winter salad became more expensive, as the supply fell back as well.
graphiqueGraph2 – Producer prices of fresh vegetables
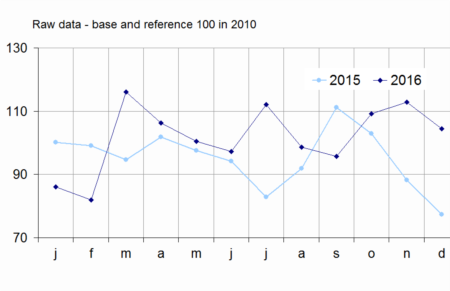
- Source: SSP (ministry in charge of agriculture)
Animal and milk prices picked up for three months
Animal prices kept on going up (+4.0% over the quarter). Large cattle prices have rebounded since the end of the milk crisis (+6.2% over three months ; −2.1% over one year). The farmers had indeed more cows slaughtered when facing milk overproduction, which weighed on the beef market. Pig prices gained almost 20% over one year, significantly buoyed by Chinese demand.
graphiqueGraph3 – Producer prices of pigs and large cattle
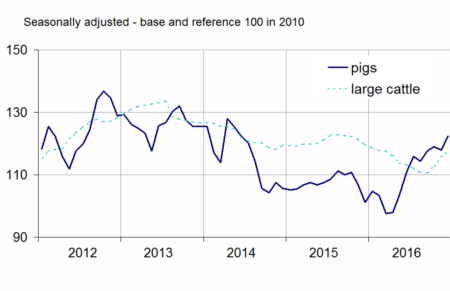
- Source: INSEE
Cow milk prices continued to pick up (+9.9% between September and November). The production of the main exporting countries declined, whereas China drove the global demand up.
tableauTable1 – Indices of producer prices of agricultural products (IPPAP)
| Variation as % over | |||||
|---|---|---|---|---|---|
| Weights | Dec. 2016 | a month | Weights | Nov. 2016 | |
| Agricultural goods output | 1000 | 117.7 | /// | /// | +5.0 |
| excluding fruits and vegetables | 900 | 118.7 | +1.0 | +4.2 | +3.8 |
| Crop output (excluding fruits and vegetables) | 505 | 123.4 | +0.6 | +2.2 | +5.2 |
| Cereals | 188 | 102.4 | –1.0 | +3.9 | –1.1 |
| of which soft wheat | 112 | 99.5 | –1.1 | +2.7 | –0.7 |
| grain maize | 41 | 100.2 | –0.2 | +5.8 | +3.6 |
| Potatoes | 26 | 250.3 | /// | /// | +43.0 |
| Wines | 177 | 135.2 | 0.0 | +0.1 | +3.6 |
| protected designation of origin | 84 | 147.4 | +0.2 | –0.1 | +7.7 |
| other wines | 23 | 138.6 | –0.7 | +1.6 | –4.4 |
| Oleaginous | 49 | 109.6 | +4.3 | +8.6 | +6.2 |
| Horticultural products | 30 | 112.0 | +1.3 | +2.4 | +2.4 |
| Other crop products | 36 | 110.9 | +1.9 | +1.6 | +2.0 |
| Fruits and vegetables (1) | 100 | 109.6 | /// | /// | +18.9 |
| Fresh vegetables | 53 | 104.4 | /// | /// | +35.1 |
| Fresh fruits | 35 | 118.1 | /// | /// | +8.1 |
| Animal output | 395 | 112.6 | +1.6 | +7.1 | +2.0 |
| Animals | 234 | 115.8 | +2.0 | +4.0 | +2.4 |
| of which large cattle | 96 | 117.5 | +1.6 | +6.2 | –2.1 |
| calves | 26 | 107.8 | +3.3 | +5.1 | –2.6 |
| pigs | 54 | 122.4 | +3.8 | +4.1 | +19.9 |
| sheep | 10 | 117.5 | +0.1 | –0.3 | +1.4 |
| poultry | 46 | 109.0 | +0.1 | –0.3 | –2.3 |
| of which chicken | 28 | 108.9 | +0.2 | +0.1 | –2.2 |
| Milk | 147 | 102.5 | /// | +9.0 | –2.2 |
| of which cow milk (2) | 137 | 101.9 | /// | +9.9 | –2.5 |
| Eggs | 15 | 162.8 | +8.2 | +38.9 | +29.3 |
- * Except for fresh fruits, fresh vegetables and potatoes
- /// Absence of result due to the nature of these series
- (1) Including vegetables for industry.
- (2)The November value of cow milk price indice is carried forward in December
- Sources: INSEE, SSP (ministry in charge of agriculture)
Rebound in purchase prices of means of production
In December 2016, intermediate consumption prices picked up (+0.8%), driven up by the rising prices of energy and fertilisers. Over one year overall input prices decreased by 1.3%: the strong decline in fetilisers prices (−13.0%), and those more moderate for seeds (−2.9%) and feed (−3.0%), were partly offset by higher energy prices (+13.5%). Capital goods prices still expanded (+0.2 % as in November) and grew by 1.4% over one year.
graphiqueGraph4 – Purchase prices of the means of agricultural production
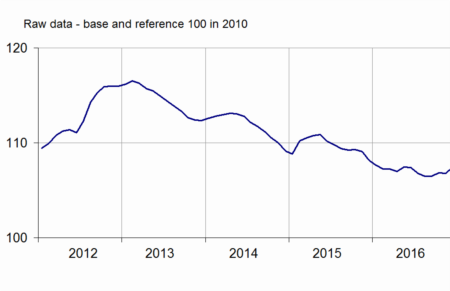
- Sources: INSEE, SSP (ministry in charge of agriculture)
tableauTable2 – Indices of purchase prices of the means of agricultural production (IPAMPA)
| Weights | Dec. 2016 | variation as % over | |||
|---|---|---|---|---|---|
| a month | 3 months | a year | |||
| Total input | 1000 | 107.4 | +0.6 | +0.8 | –0.6 |
| Intermediate consumptions | 764 | 107.3 | +0.8 | +0.9 | –1.3 |
| Energy | 100 | 98.6 | +3.6 | +6.5 | +13.5 |
| Seeds | 57 | 105.5 | –0.8 | –1.4 | –2.9 |
| Fertilisers and soil improvers | 92 | 100.7 | +3.0 | +3.5 | –13.0 |
| Plant protection products | 78 | 100.1 | –0.6 | –0.7 | –0.5 |
| Animal feed | 205 | 112.1 | +0.2 | –0.1 | –3.0 |
| Veterinary expenses | 43 | 118.2 | 0.0 | +0.1 | +3.0 |
| Small equipment and tools | 17 | 107.9 | –0.9 | –1.5 | –1.7 |
| Maintenance of materials | 67 | 113.9 | +0.2 | +0.2 | +0.3 |
| Maintenance of buildings | 9 | 108.0 | 0.0 | +0.2 | +1.3 |
| Other goods and services | 97 | 103.7 | +0.1 | +0.1 | –0.7 |
| Goods and services contributing to investment | 236 | 108.2 | +0.2 | +0.7 | +1.4 |
| Material | 186 | 109.4 | +0.1 | +1.0 | +1.4 |
| Tractors | 79 | 109.8 | 0.0 | +1.3 | +2.0 |
| Machinery and equipment for cultivation | 36 | 111.7 | +0.8 | +0.5 | +1.5 |
| Machinery and equipment for harvesting | 42 | 109.9 | 0.0 | +1.4 | +1.2 |
| Utility vehicles | 18 | 104.7 | +0.1 | +0.9 | +0.2 |
| Buildings | 50 | 103.4 | 0.0 | –0.9 | +1.0 |
- (1) The repayment of the domestic tax on energy product (TICPE) benefiting farmers has been applied in advance for the year 2016
- Sources: INSEE, SSP (ministry in charge of agriculture)
Revision
The variation in IPPAP in November 2016 has been raised by 0.3 points owing to the integration of cow milk price. The IPAMPA of november has not been revised.
Documentation
Methodology (pdf,122 Ko)
Pour en savoir plus
Time series : Indices of agricultural prices
