


 25 January 2017
2017- n° 19In January 2017, the business climate declines sharply in services Monthly survey of services - January 2017
25 January 2017
2017- n° 19In January 2017, the business climate declines sharply in services Monthly survey of services - January 2017
According to business managers surveyed in January 2017, the business climate in services has declined sharply after a strong rise in the previous month. The composite indicator which measures it has decreased by four points and has returned to its level of November 2016 (102), however above its long-term average (100).
- The expectations on activity and demand have declined
- The business climate remains favourable in road transport
- The business climate has declined markedly in accommodation and food service activities
- In information and communication, the business climate has fallen back to its average
- The real estate business climate has deteriorated
- The business climate has weakened in professional, scientific and technical activities
- In administrative and support service activities, the business climate has hardly faltered
According to business managers surveyed in January 2017, the business climate in services has declined sharply after a strong rise in the previous month. The composite indicator which measures it has decreased by four points and has returned to its level of November 2016 (102), however above its long-term average (100).
graphiqueGraph1 – Business climate composite indicator

The turning point indicator has returned to the uncertainty area.
graphiqueGraph2 – Turning point indicator
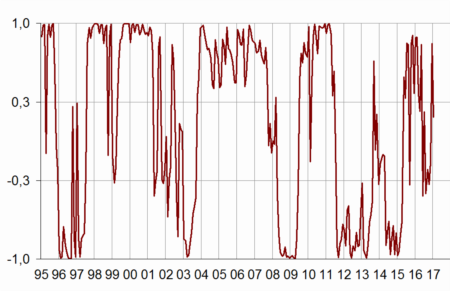
- Note: close to 1 (respectively -1), this indicator indicates a favourable short-term economic situation (respectively unfavourable). Between +0.3 and -0.3: uncertainty area.
The expectations on activity and demand have declined
The balance of opinion on past activity has dipped slightly, still just above its long-term mean. Much fewer business leaders than in December expect an increase in activity and demand for the coming months. The
balance on expected activity has even slipped somewhat below its long-term average. However, the balance of opinion on the general outlook is still well above its long term average.
The balance of opinion on the past operating balance has improved markedly since October and has climbed above its long-term average. In contrast, the balance on expected operating result has deteriorated and has moved below its long-term average.
The balance on past employment has gone up, whereas that on expected employment is virtually stable. Both balances stand clearly above their long-term average.
tableauTable1 – Economic outlook in the services sector
| Average* | Oct. 16 | Nov. 16 | Dec. 16 | Jan. 17 | |
|---|---|---|---|---|---|
| Composite indicator | 100 | 101 | 102 | 106 | 102 |
| General outlook | –8 | –5 | –6 | –1 | –3 |
| Past activity | 2 | –2 | 0 | 5 | 3 |
| Expected activity | 2 | –1 | 1 | 5 | 0 |
| Expected demand | –1 | 2 | 2 | 6 | 0 |
| Past selling prices | –4 | –6 | –3 | –4 | –6 |
| Expected selling prices | –3 | –7 | –8 | –5 | –9 |
| Past employment | 3 | 10 | 5 | 10 | 14 |
| except temporary work agencies | 1 | 2 | 2 | 6 | 6 |
| Expected employment | 2 | 8 | 11 | 11 | 10 |
| except temporary work agencies | –1 | 4 | 5 | 4 | 4 |
| Investments | |||||
| Past investments | 2 | 7 | 5 | 8 | 7 |
| Expected investments | 1 | 3 | 5 | 6 | 9 |
| Operating balance result | |||||
| Past result | –2 | –3 | 4 | ||
| Expected result | –2 | 3 | –7 | ||
| Cash position | –11 | –8 | –11 | ||
| Difficulties of supply and demand | |||||
| difficulties of supply and demand | 10 | 9 | 12 | ||
| difficulties of supply only | 22 | 22 | 21 | ||
| difficulties of demand only | 32 | 35 | 33 | ||
| Difficulties in recruitment | 27 | 24 | 27 |
- * Average since 1989 for the composite indicator and since 1988 for the balances of opinion
- Source: Insee, business survey in services
The decline in the business climate in services comes from a decrease in all sub-sectors. However, except in accomodation and food services, the composite indicators remain equal or above their long term average.
The business climate remains favourable in road transport
In road transport, the business climate has barely faltered in January (107) and remains clearly above its long term average. In particular, the balance on expected activity has decreased. However, all the balances are still well above their long-term average.
The business climate has declined markedly in accommodation and food service activities
In accommodation and food service activities, the business climate has lost six points (98), returning below its long term average. In particular, the balances on activity, demand, general outlook and expected employment have decreased. They have returned below their long term average, except those concerning expected employment and activity.
In information and communication, the business climate has fallen back to its average
In information and communication, the business climate has lost three points returning to its mean. The expectations on activity and demand have deteriorated sharply. The corresponding balances stand below their long term average. However, the balances on employment have improved, above their long-term average.
The real estate business climate has deteriorated
In real estate, the business climate has lost four points (101), still slightly above its long-term average. The balance on past activity has gone down sharply but remains above its mean. In contrast, the balance concerning expected emloyement has improved significantly.
The business climate has weakened in professional, scientific and technical activities
In professional, scientific and technical activities, the business climate has slightly weakened (103), though still above its mean. The balance on expected activity has decreased markedly, moving below its long term average. However, the balances on employment remain on a favourable track.
In administrative and support service activities, the business climate has hardly faltered
In administrative and support service activities, the business climate has hardly declined (106), still clearly above its long term average. The balance on past activity has improved markedly whereas those on expected activity and demand have slightly decreased, still above their mean. The balances on employment remain far above their long-term average.
tableauTable2 – Business climate composite indicator and balances of opinion by sub-sector in services
| Aggregated classification (NA 2008) at level A21 | Mean* | Oct. 16 | Nov. 16 | Dec. 16 | Jan. 17 |
|---|---|---|---|---|---|
| Road transport (8%) | |||||
| Composite indicator | 100 | 104 | 104 | 108 | 107 |
| Past activity | –8 | –1 | –11 | –6 | –2 |
| Expected activity | –9 | –7 | –8 | 2 | –1 |
| Expected demand | –12 | –6 | –3 | 2 | 1 |
| Past employment | –7 | 1 | 1 | 4 | 5 |
| Expected employment | –10 | –1 | 1 | 9 | –1 |
| General outlook | –23 | –6 | –8 | –8 | –6 |
| Accommodation and food service activities (11%) | |||||
| Composite indicator | 100 | 98 | 102 | 104 | 98 |
| Past activity | –7 | –15 | –11 | –8 | –10 |
| Expected activity | –8 | –6 | –8 | –5 | –8 |
| Expected demand | –10 | –8 | –2 | –5 | –13 |
| Past employment | –4 | –5 | –7 | 0 | 1 |
| Expected employment | –5 | 3 | 8 | 0 | –5 |
| General outlook | –14 | –23 | –15 | –9 | –16 |
| Information and communication (24%) | |||||
| Composite indicator | 100 | 102 | 102 | 103 | 100 |
| Past activity | 8 | –4 | 7 | 12 | –2 |
| Expected activity | 9 | –1 | 4 | 8 | –4 |
| Expected demand | 10 | 18 | 13 | 15 | 0 |
| Past employment | 6 | 12 | 17 | 17 | 22 |
| Expected employment | 10 | 17 | 13 | 10 | 12 |
| General outlook | 0 | –1 | –1 | –1 | –1 |
| Real estate activities (13%) | |||||
| Composite indicator | 100 | 100 | 102 | 105 | 101 |
| Past activity | 7 | 5 | 8 | 17 | 9 |
| Expected activity | 8 | 11 | 8 | 9 | 7 |
| Expected demand | 1 | 0 | 3 | 8 | 5 |
| Past employment | 3 | 5 | 8 | 7 | 5 |
| Expected employment | 2 | 3 | 6 | 2 | 13 |
| General outlook | –2 | 3 | 1 | 6 | 3 |
| Professional, scientific and technical activities (24%) | |||||
| Composite indicator | 100 | 100 | 101 | 105 | 103 |
| Past activity | –1 | –3 | –1 | 0 | 4 |
| Expected activity | –2 | –5 | –3 | 1 | –6 |
| Expected demand | –6 | –7 | –4 | –2 | –1 |
| Past employment | 1 | –1 | 3 | 8 | 10 |
| Expected employment | 0 | 6 | 5 | 6 | 8 |
| General outlook | –9 | –4 | –6 | –2 | –4 |
| Administrative and support service activities (18%) | |||||
| Composite indicator | 100 | 101 | 100 | 107 | 106 |
| Past activity | 6 | –2 | –3 | 7 | 15 |
| Expected activity | 5 | 4 | 7 | 12 | 9 |
| Expected demand | 3 | 3 | 1 | 12 | 9 |
| Past employment | 9 | 23 | 9 | 18 | 24 |
| Expected employment | 7 | 15 | 19 | 22 | 21 |
| General outlook | –5 | –3 | –3 | 3 | 1 |
- The figures in parentheses indicate the weights used to aggregate the sub-sector balances of opinion..
- *Composite indicators: average since 1989 (2006 for road transport); balances of opinion : average since 1988 (2006 for road transport)
- Source: INSEE, monthly business survey in services.
Documentation
Abbreviated Methodology (2017) (pdf,177 Ko)
Pour en savoir plus
Time series : Economic outlook surveys – Services
