


 23 December 2016
2016- n° 342In Q3 2016, households' purchasing power accelerated Quarterly national accounts - detailed figures - third quarter 2016
23 December 2016
2016- n° 342In Q3 2016, households' purchasing power accelerated Quarterly national accounts - detailed figures - third quarter 2016
In Q3 2016, gross domestic product (GDP) in volume terms* recovered moderately: +0.2% after −0.1% in Q2.
Household consumption expenditure were virtually stable (+0.1% after 0.0%). Non-financial enterprises' GFCF stabilized (0.0% after −0.1%), while households' gross fixed capital formation (GFCF) accelerated again (+0.7% after +0.4%). Overall, final domestic demand (excluding inventory changes) sped up slightly: it contributed for +0.2 points to GDP growth in Q3 2016 after +0.1 points in the previous quarter.
Imports bounced back sharply (+2.5% after −1.5%). Exports accelerated (+0.7% after +0.1%), however less than imports. Overall, foreign trade balance contributed negatively to GDP growth (−0.6 points after +0.5 points). Conversely, changes in inventories contributed positively (+0.6 points after −0.8 points).

* This growth rate is seasonally and working-day adjusted; volumes are chain-linked previous-year-prices volumes.
graphiqueGraph – GDP and its main components
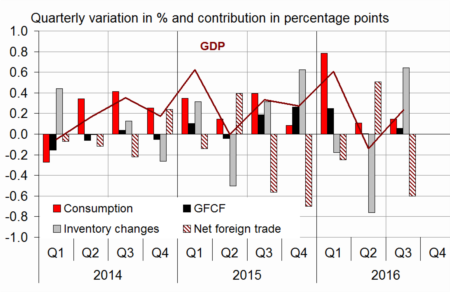
- Source: INSEE
tableauTable1 – Goods and services: supply and uses chain-linked volumes
| 2015 Q4 | 2016 Q1 | 2016 Q2 | 2016 Q3 | 2015 | 2016 (ovhg) | |
|---|---|---|---|---|---|---|
| GDP | 0.3 | 0.6 | -0.1 | 0.2 | 1.2 | 1.0 |
| Imports | 2.7 | 0.4 | -1.5 | 2.5 | 6.4 | 3.4 |
| Household consumption *expenditure | 0.0 | 1.3 | 0.0 | 0.1 | 1.5 | 1.6 |
| General government's *consumption expenditure | 0.4 | 0.4 | 0.4 | 0.3 | 1.4 | 1.4 |
| GFCF | 1.2 | 1.2 | 0.0 | 0.3 | 0.9 | 2.6 |
| *of which Non-financial corporated and unincorporated enterprises | 1.6 | 2.0 | -0.1 | 0.0 | 2.7 | 3.8 |
| Households | 0.4 | 0.3 | 0.4 | 0.7 | -0.8 | 1.3 |
| General government | 1.1 | -0.7 | -0.2 | 0.4 | -3.9 | 0.4 |
| Exports | 0.5 | -0.5 | 0.1 | 0.7 | 6.0 | 0.6 |
| Contributions: | ||||||
| Internal demand excluding inventory changes | 0.3 | 1.0 | 0.1 | 0.2 | 1.3 | 1.8 |
| Inventory changes | 0.6 | -0.2 | -0.8 | 0.6 | 0.2 | 0.1 |
| Net foreign trade | -0.7 | -0.2 | 0.5 | -0.6 | -0.3 | -0.9 |
- Source: INSEE
tableauTable2 – Production, consumption and GFCF: main components
| 2015 Q4 | 2016 Q1 | 2016 Q2 | 2016 Q3 | 2015 | 2016 (ovhg) | |
|---|---|---|---|---|---|---|
| Production of branches | 0.5 | 0.6 | -0.2 | 0.5 | 1.3 | 1.2 |
| Goods | 0.3 | 0.2 | -0.8 | 0.0 | 1.2 | -0.1 |
| Manufactured Industry | 0.7 | 0.3 | -1.1 | 0.6 | 1.5 | 0.4 |
| Construction | 0.6 | 0.4 | -0.3 | 0.9 | -2.2 | 0.7 |
| Market services | 0.6 | 0.9 | -0.1 | 0.7 | 1.8 | 2.0 |
| Non-market services | 0.3 | 0.4 | 0.3 | 0.3 | 1.0 | 1.2 |
| Household consumption | 0.0 | 1.3 | 0.0 | 0.1 | 1.5 | 1.6 |
| Food products | 0.4 | 0.4 | -0.6 | 0.9 | 1.2 | 0.9 |
| Energy | -3.3 | 2.4 | 1.4 | -1.4 | 1.4 | 0.9 |
| Engineered goods | -0.3 | 2.3 | 0.2 | -1.1 | 2.6 | 2.3 |
| Services | 0.3 | 0.7 | -0.2 | 0.4 | 1.0 | 1.3 |
| GFCF | 1.2 | 1.2 | 0.0 | 0.3 | 0.9 | 2.6 |
| Manufactured goods | 3.3 | 2.6 | 0.1 | -2.3 | 2.1 | 5.5 |
| Construction | 0.6 | 0.5 | -0.1 | 0.7 | -2.2 | 0.9 |
| Market services | 0.7 | 1.1 | 0.1 | 1.4 | 4.4 | 3.0 |
- Source: INSEE
Households' purchasing power accelerated
Households' gross disposable income (GDI) accelerated in Q3 (+0.7% after +0.3%). Indeed, taxes on income and wealth fell back (−1.2% after +0.5%), due to a decrease in the income tax for median income households.
Besides, wages earned by households increased more than in Q2 (+0.6% after +0.4%), due to the rise in the average wage per capita paid by non-financial corporations (+0.3% after +0.1%). Lastly, social benefits in cash were a little more dynamic (+0.5% after +0.4% in Q2).
Furthermore, households' consumption prices increased in Q3 at the same slow pace than in Q2 (+0.1%).
Therefore households' purchasing power accelerated to the same extent than GDI in Q3 (+0.6% after +0.2%). Measured per consumption unit to assess it at an individual level, it had a similar profile (+0.5% after +0.1% in Q2).
As households' consumption in volume terms was sluggish, their savings ratio increased; it reached 14.9% of their GDI, after 14.5% in Q2.
tableauTable3 – Sectoral accounts
| 2015 Q4 | 2016 Q1 | 2016 Q2 | 2016 Q3 | 2015 | 2016 (ovhg) | |
|---|---|---|---|---|---|---|
| Profit ratio of NFC* (level) | 31.6 | 31.9 | 31.5 | 31.5 | 31.4 | |
| Household purchasing power | 0.5 | 0.6 | 0.2 | 0.6 | 1.6 | 1.9 |
- *NFC: non-financial corporations
- Source: INSEE
tableauTable4 – Households' disposable income and ratios of households' account
| 2015 Q4 | 2016 Q1 | 2016 Q2 | 2016 Q3 | 2015 | 2016 (ovhg) | |
|---|---|---|---|---|---|---|
| HDI | 0.5 | 0.5 | 0.3 | 0.7 | 1.4 | 1.9 |
| Household purchasing power | 0.5 | 0.6 | 0.2 | 0.6 | 1.6 | 1.9 |
| HDI by cu* (purchasing power) | 0.4 | 0.5 | 0.1 | 0.5 | 1.2 | 1.5 |
| Adjusted HDI (purchasing power) | 0.5 | 0.6 | 0.2 | 0.6 | 1.6 | 1.8 |
| Saving rate (level) | 14.9 | 14.4 | 14.5 | 14.9 | 14.5 | |
| Financial saving rate (level) | 5.9 | 5.6 | 5.5 | 5.9 | 5.5 |
- *cu: consumption unit
- Source: INSEE
Non-financial corporations' profit ratio was stable at 31.5%
In Q3 2016, apparent labour productivity fell back slightly whereas real wages increased a little, which weighed down on the profit ratio. Conversely, the hiring premium for SMEs has been ramped up. Overall, the profit ratio held steady at 31.5%.
tableauTable5 – Ratios of non-financial corporations' account
| 2015 Q4 | 2016 Q1 | 2016 Q2 | 2016 Q3 | 2015 | |
|---|---|---|---|---|---|
| Profit share | 31.6 | 31.9 | 31.5 | 31.5 | 31.4 |
| Investment ratio | 23.1 | 23.3 | 23.4 | 23.4 | 22.9 |
| Savings ratio | 20.0 | 21.1 | 20.4 | 20.4 | 19.7 |
| Self-financing ratio | 86.5 | 90.8 | 87.2 | 87.4 | 86.3 |
- Source: INSEE
In Q3 2016, general government deficit increased anew
In Q3 2016, general government net borrowing rose anew, at 3.5% of GDP after 3.2%.
Expenditure accelerated (+0.7% after +0.3%), notably as an after-effect of the sale of new 4G frequencies in Q2 (registered as a lesser expenditure in national accounts).
Conversely, receipts slowed down in Q3 (+0.2% after +0.6%), notably because of tax measures alleviating income taxes.
tableauTable6 – Expenditure, receipts and net borrowing of public administrations
| 2015 Q4 | 2016 Q1 | 2016 Q2 | 2016 Q3 | 2015 | |
|---|---|---|---|---|---|
| In billions of euros | |||||
| Total expenditure | 310.7 | 313.7 | 314.7 | 317.0 | 1242.8 |
| Total receipts | 295.2 | 295.0 | 296.9 | 297.3 | 1166.3 |
| Net lending (+) or borrowing (-) | -15.5 | -18.7 | -17.8 | -19.7 | -76.5 |
| In % of GDP | |||||
| Net lending (+) or borrowing (-) | -2.8 | -3.4 | -3.2 | -3.5 | -3.5 |
- Source: INSEE
Revisions
GDP growth rate in Q3 2016 is not revised (+0.2%) Vegetal production for 2016 is lowered again and many indicators have been updated, including quarterly data from balance of payments, which leads to slight revisions on past quarters.
Pour en savoir plus
