


 16 December 2016
2016- n° 326In December 2016, the business climate improves markedly in services Monthly survey of services - December 2016
16 December 2016
2016- n° 326In December 2016, the business climate improves markedly in services Monthly survey of services - December 2016
According to business managers surveyed in December 2016, the business climate in services has improved markedly. The business climate composite indicator has increased by four points (106) and stands well above its long-term average (100). It has reached its highest level since mid-2011.
- Business prospects have improved significantly
- Clear improvement of the climate in road transport
- In accommodation and food services, the business climate has risen again
- The business climate is stable in information and communication
- The business climate in real estate activities has improved slightly
- In professional, scientific and technical activities, the business climate has improved markedly
- The business climate has jumped in administrative and support service activities
According to business managers surveyed in December 2016, the business climate in services has improved markedly. The business climate composite indicator has increased by four points (106) and stands well above its long-term average (100). It has reached its highest level since mid-2011.
graphiqueGraph1 – Business climate composite indicator

The turning point indicator has returned into the area indicating a favourable short-term outlook.
graphiqueGraph2 – Turning point indicator
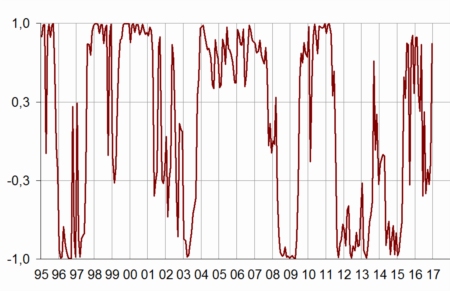
- Note: close to 1 (respectively −1), this indicator indicates a favourable short-term economic situation (respectively unfavourable). Between +0.3 and −0.3: uncertainty area.
Business prospects have improved significantly
The balance on general outlook, which relates the assessment of business leaders over their whole sector, has improved markedly and stands well above its long-term average. The balances of opinion on past and expected activity and on expected demand have increased sharply and exceed their long-term average.
The balance on past employment has increased anew after a decline in November, whereas that on expected employment is virtually stable. Both balances stand above their long-term average.
The balance on past investments has increased slightly, whereas that on expected investments is unchanged. Both balances stand above their long-term average.
tableauTable1 – Economic outlook in the services sector
| Average* | Sept. 16 | Oct. 16 | Nov. 16 | Dec. 16 | |
|---|---|---|---|---|---|
| Composite indicator | 100 | 102 | 101 | 102 | 106 |
| General outlook | –8 | –7 | –5 | –6 | –2 |
| Past activity | 2 | –3 | –2 | 0 | 4 |
| Expected activity | 2 | 2 | –1 | 1 | 6 |
| Expected demand | –1 | 2 | 2 | 2 | 7 |
| Past selling prices | –4 | –4 | –6 | –3 | –4 |
| Expected selling prices | –3 | –4 | –7 | –8 | –5 |
| Past employment | 3 | 8 | 10 | 5 | 9 |
| except temporary work agencies | 1 | 3 | 2 | 2 | 5 |
| Expected employment | 2 | 11 | 8 | 11 | 10 |
| except temporary work agencies | –1 | 6 | 4 | 5 | 4 |
| Investments | |||||
| Past investments | 1 | 5 | 7 | 5 | 7 |
| Expected investments | 1 | 4 | 3 | 5 | 5 |
- * Average since 1989 for the composite indicator and since 1988 for the balances of opinion
- Source: INSEE, monthly business survey in services.
In most subsectors, the business climate has risen significantly, from three to six points. However, it is steady in information and communication and has increased moderately in real estate.
Clear improvement of the climate in road transport
In road transport, the business climate has increased markedly (+4 points). At 108, it stands clearly above its long-term average. The balances on expected activity and demand as well as those on past and expected employment have gone up markedly.
In accommodation and food services, the business climate has risen again
In accommodation and food services, the business climate has increased by three points (105). The balances on past employment and general outlook have picked up sharply and have returned above their long-term average.
The business climate is stable in information and communication
In information and communication, the business climate has remained slightly above its long-term average since September (102). The increase in the balances on past and expected activity is offset by the decline in the balance on expected employment.
The business climate in real estate activities has improved slightly
In real estate activities, the business climate has gone up by one point (103). The balances on past activity and expected demand have increased again, whereas the balance on expected employment has fallen back to its long-term average. The general outlook balance stands clearly above its long-term average.
In professional, scientific and technical activities, the business climate has improved markedly
The business climate in professional, scientific and technical activities has gone up by five points, whereas it had been almost stable at its long-term average since September. At 106, it has reached its highest level since the summer 2011. This increase is due to the balances on expected activity and demand, on past employment and on general outlook.
The business climate has jumped in administrative and support service activities
In administrative and support service activities, the business climate has increased by six points (at 106). All balances have gone up: almost all of them stand clearly above their long-term average. Only the balance on past activity stands slightly below its long-term average.
tableauTable2 – Business climate composite indicator and balances of opinion by sub-sector in services
| Aggregated classification (NA 2008) at level A21 | Mean* | Sept. 16 | Oct. 16 | Nov. 16 | Dec. 16 |
|---|---|---|---|---|---|
| Road transport (8%) | |||||
| Composite indicator | 100 | 103 | 104 | 104 | 108 |
| Past activity | –8 | –4 | –1 | –11 | –8 |
| Expected activity | –9 | –8 | –7 | –8 | 2 |
| Expected demand | –12 | –6 | –6 | –3 | 4 |
| Past employment | –7 | 0 | 1 | 1 | 6 |
| Expected employment | –10 | –4 | –1 | 1 | 10 |
| General outlook | –23 | –13 | –6 | –8 | –10 |
| Accommodation and food service activities (11%) | |||||
| Composite indicator | 100 | 98 | 98 | 102 | 105 |
| Past activity | –7 | –13 | –15 | –11 | –6 |
| Expected activity | –8 | –5 | –6 | –8 | –5 |
| Expected demand | –10 | –12 | –8 | –2 | –3 |
| Past employment | –4 | –6 | –5 | –7 | –1 |
| Expected employment | –5 | –1 | 3 | 8 | 1 |
| General outlook | –14 | –23 | –23 | –15 | –8 |
| Information and communication (24%) | |||||
| Composite indicator | 100 | 102 | 102 | 102 | 102 |
| Past activity | 8 | –4 | –4 | 7 | 13 |
| Expected activity | 9 | 5 | –1 | 4 | 10 |
| Expected demand | 10 | 18 | 18 | 13 | 16 |
| Past employment | 6 | 3 | 12 | 17 | 16 |
| Expected employment | 10 | 18 | 17 | 13 | 8 |
| General outlook | 0 | –3 | –1 | –1 | –1 |
| Real estate activities (13%) | |||||
| Composite indicator | 100 | 102 | 101 | 102 | 103 |
| Past activity | 7 | 4 | 5 | 8 | 13 |
| Expected activity | 8 | 16 | 11 | 8 | 10 |
| Expected demand | 1 | –1 | 0 | 3 | 6 |
| Past employment | 3 | 5 | 5 | 8 | 5 |
| Expected employment | 2 | 7 | 3 | 6 | 2 |
| General outlook | –2 | –2 | 3 | 1 | 5 |
| Professional, scientific and technical activities (24%) | |||||
| Composite indicator | 100 | 100 | 100 | 101 | 106 |
| Past activity | –1 | –3 | –3 | –1 | –3 |
| Expected activity | –2 | –4 | –5 | –3 | 3 |
| Expected demand | –6 | –4 | –7 | –4 | 0 |
| Past employment | 1 | –3 | –1 | 3 | 7 |
| Expected employment | 0 | 8 | 6 | 5 | 5 |
| General outlook | –9 | –7 | –4 | –6 | –2 |
| Administrative and support service activities (18%) | |||||
| Composite indicator | 100 | 101 | 101 | 100 | 106 |
| Past activity | 6 | 0 | –2 | –3 | 5 |
| Expected activity | 5 | 6 | 4 | 7 | 11 |
| Expected demand | 3 | 1 | 3 | 1 | 11 |
| Past employment | 9 | 23 | 23 | 9 | 15 |
| Expected employment | 7 | 22 | 15 | 19 | 21 |
| General outlook | –5 | –3 | –3 | –3 | 3 |
- The figures in parentheses indicate the weights used to aggregate the sub-sector balances of opinion.
- *Composite indicators: average since 1989 (2006 for road transport); balances of opinion : average since 1988 (2006 for road transport)
- Source : INSEE, monthly business survey in services.
Documentation
Methodology (2016) (pdf,158 Ko)
Pour en savoir plus
Time series : Economic outlook surveys – Services
