


 7 December 2016
2016- n° 287In August 2016, the turnover recovered strongly in the manufacturing industry (+3.2%) Turnover in industry and construction - August 2016
7 December 2016
2016- n° 287In August 2016, the turnover recovered strongly in the manufacturing industry (+3.2%) Turnover in industry and construction - August 2016
In August 2016, the turnover in the manufacturing industry recovered strongly (+3.2% after −0.7% in July). Export turnover picked up especially (+3.1% after −0.4%).
In the industry as a whole, the turnover also recovered to a similar extent (+3.1% after −0.3%).

Every index in this issue is in value (tax excluded), seasonally and working day adjusted. The commentary shows variations of subsections by decreasing contribution. The contribution of a subsection depends on the extent of the change and on its weight.
In August 2016, the turnover in the manufacturing industry recovered strongly (+3.2% after −0.7% in July). Export turnover picked up especially (+3.1% after −0.4%).
In the industry as a whole, the turnover also recovered to a similar extent (+3.1% after −0.3%).
Fall over the last three months (−0.9%)
Over the last three months, the turnover shrank in the manufacturing industry (−0.9%) and in the industry as a whole (−0.6%). It decreased sharply in the manufacturing of transport equipment (−4.2%) and, to a lesser degree, in “other manufacturing” (−0.8%) and in machinery and equipment goods (−0.4%). On the other hand, the turnover rose in the manufacturing of food products and beverages (+1.2%) and in that of coke and refined petroleum products (+0.5%).
Decline compared to the previous year (−1.2%)
The turnover declined over the last three months, compared to the same three months of the previous year in the manufacturing industry (−1.2%) as in the industry as a whole (−1.3%). Over this period, the turnover tumbled in the manufacture of coke and refined petroleum products (−14.9%). It declined in “other manufacturing” (−1.7%) and in the manufacture of machinery and equipment goods (−1.7%). Conversely, it advanced in the manufacturing of transport equipment (+2.4%). It was virtually stable in the manufacture of food products and beverages (+0.1%).
graphiqueIRgraph3 – Turnover in manufacturing industry
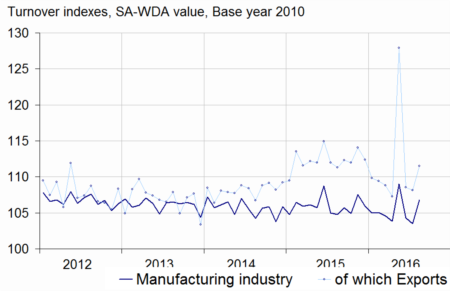
- Source: INSEE
graphiqueIRGraph4 – Turnover in manufacturing industry by sector
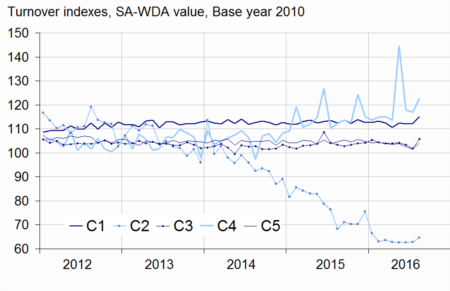
- Source: INSEE
tableauIRtab5 – Variation of the turnover in industry and construction
| Change in % | |||||
|---|---|---|---|---|---|
| NA : A 10, (A 17) | Weight** | Aug./ July | July/ June | q-o-q (1) | y-o-y (2) |
| BE: INDUSTRY | 10000 | 3.1 | −0.3 | −0.6 | −1.3 |
| CZ: MANUFACTURING INDUSTRY | 8346 | 3.2 | −0.7 | −0.9 | −1.2 |
| Of which Exports | 2677 | 3.1 | −0.4 | −4.6 | −3.0 |
| (C1): Manufacture of food products and beverages | 1685 | 2.6 | 0.1 | 1.2 | 0.1 |
| (C2): Manufacture of coke and refined petroleum products | 561 | 3.2 | 0.0 | 0.5 | −14.9 |
| (C3): Machinery and equipment goods | 953 | 4.0 | −1.5 | −0.4 | −1.7 |
| (C4): Manufacture of transport equipment | 1265 | 5.0 | −0.9 | −4.2 | 2.4 |
| (C5): Other manufacturing | 3881 | 2.6 | −1.0 | −0.8 | −1.7 |
| DE: Mining and quarrying; energy; water supply; waste management | 1654 | 2.8 | 1.7 | 0.8 | −1.8 |
| FZ: CONSTRUCTION | 10000 | 2.7 | −1.7 | −1.6 | −1.8 |
- ** 10000=B...E and F
- (1) Quarter-on-quarter: last three months / previous three months
- (2) Year-on-year: last three months / same three months of previous year
- The codes correspond to different levels of aggregation of the NACE classification.
- Source: INSEE
Strong rebound in the manufacture of transport equipment (+5.0%)
The turnover in the manufacture of transport equipment rebounded strongly in August (+5.0% after −0.9% in July). It picked up in the manufacture of motor vehicles, trailers and semi-trailers (+6.4%) and, to a lesser extent in that of other transport equipment (+3.8%).
Sharp upturn in machinery and equipment goods (+4.0%)
The turnover of machinery and equipment goods surged in August (+4.0%) after two months of decline (−1.5% in July and −0.9% in June). It accelerated in the manufacture of computer, electronic and optical products (+6.4% after +0.4%) and bounced back markedly in the manufacture of electrical equipment (+9.1% after −6.0%). By contrast, it declined again slightly in the manufacturing of machinery and equipment n.e.c. (−0.4% as in July).
Rebound in “other manufacturing” (+2.6%)
The turnover in “other manufacturing” recovered sharply in August (+2.6% after −1.0% in July). In particular, it rose strongly in the manufacture of chemicals and chemical products (+4.4% after +3.0%). It recovered sharply in the manufacture of basic pharmaceutical products and pharmaceutical preparations (+8.0% after −6.6%) and in the other manufacturing ; repair and installation of machinery and equipment sector (+3.4% after −3.3%). The rebound is more moderate in the manufacture of basic metals and fabricated metal products (+1.1% after −1.1%).
Rise in food products and beverages (+2.6%)
The turnover rose in the manufacture of food products and beverages in August (+2.6%) after a near stability in July (+0.1%).
Recovery in coke and refined petroleum products (+3.2%)
In August, the turnover picked up in coke and refined petroleum products (+3.2%) after a stability in July, preceded by three consecutive months of growth.
Revisions:
In the manufacturing industry, the variation in turnover for July 2016 is unchanged, at −0.7%. It has been lowered by 0.1 points in the industry as a whole.
tableauIRtab8 – Indexes of turnover in industry and construction
| Change in % | |||||
|---|---|---|---|---|---|
| Industries: | Weight* | Aug. 2016 | Aug./ July | July/ June | q-o-q (1) |
| BE: INDUSTRY | 10000 | 108.6 | 3.1 | −0.3 | −0.6 |
| CZ: MANUFACTURING INDUSTRY | 8346 | 106.8 | 3.2 | −0.7 | −0.9 |
| of which Exports | 2677 | 111.5 | 3.1 | −0.4 | −4.6 |
| (C1): Man. of food products and beverages | 1685 | 115.1 | 2.6 | 0.1 | 1.2 |
| of which Exports | 285 | 118.7 | 3.4 | −0.9 | 2.5 |
| (C2): Man. of coke and refined petroleum products | 561 | 64.7 | 3.2 | 0.0 | 0.5 |
| (C3): Machinery and equipment goods | 953 | 105.9 | 4.0 | −1.5 | −0.4 |
| of which Exports | 469 | 102.6 | 1.6 | 0.7 | 0.3 |
| [CI] Man. of computer, electronic and optical products | 306 | 109.8 | 6.4 | 0.4 | 1.8 |
| [CJ] Man. of electrical equipment | 245 | 100.5 | 9.1 | −6.0 | −0.8 |
| [CK] Man. of machinery and equipment n.e.c. | 402 | 106.2 | −0.4 | −0.4 | −1.7 |
| (C4): Man. of transport equipment | 1265 | 122.8 | 5.0 | −0.9 | −4.2 |
| of which Exports | 617 | 127.5 | 5.1 | −0.7 | −16.8 |
| [CL1] Man. of motor vehicles, trailers and semi-trailers | 702 | 105.5 | 6.4 | −1.9 | 1.3 |
| [CL2] Man. of other transport equipment | 562 | 144.5 | 3.8 | 0.0 | −8.7 |
| (C5): Other manufacturing | 3881 | 104.3 | 2.6 | −1.0 | −0.8 |
| of which Exports | 1237 | 107.1 | 2.7 | −1.3 | −0.3 |
| [CB] Man. of textiles, wearing apparel, leather and related products | 188 | 110.0 | 0.7 | 0.0 | 0.2 |
| [CC] Man. of wood and paper products; printing and reproduction of recorded media | 436 | 96.4 | 1.1 | −0.7 | −0.4 |
| [CE] Man. of chemicals and chemical products | 745 | 101.3 | 4.4 | 3.0 | −1.2 |
| [CF] Man. of basic pharmaceutical products and pharmaceutical preparations | 304 | 114.6 | 8.0 | −6.6 | 1.6 |
| [CG] Man. of rubber and plastics products, and other non-metallic mineral products | 629 | 102.4 | 0.5 | 0.1 | −0.2 |
| [CH] Man. of basic metals and fabricated metal products, except machinery and equipment | 926 | 98.8 | 1.1 | −1.1 | −1.4 |
| [CM] Other manufacturing; repair and installation of machinery and equipment | 653 | 116.1 | 3.4 | −3.3 | −1.9 |
| DE: Mining and quarrying; energy, water supply, sewerage, waste management | 1654 | 117.7 | 2.8 | 1.7 | 0.8 |
| [BZ] Mining and quarrying | 70 | 90.7 | 0.0 | 2.1 | 0.7 |
| [DZ] Electricity, gas, steam and air-conditioning supply | 1205 | 119.8 | 1.9 | 1.6 | 1.2 |
| [EZ] Water supply; sewerage, waste management and remediation | 379 | 116.1 | 6.3 | 1.9 | −0.5 |
| FZ: CONSTRUCTION | 10000 | 102.3 | 2.7 | −1.7 | −1.6 |
- ** 10000=B...E and F
- (1) Quarter-on-quarter: last three months / previous three months
- Source: INSEE
tableauIRtab7 – Revisions of variations
| July/ June | June/ May. | May/ Apr. | Q2 2016/ Q1 2016 | 2015/ 2014 | |
|---|---|---|---|---|---|
| Industry (BE) | −0.15 | 0.06 | 0.01 | 0.27 | −0.01 |
| raw serie | −0.19 | −0.04 | −0.04 | 0.07 | 0.00 |
| SA-WDA coeff. | 0.04 | 0.10 | 0.05 | 0.20 | −0.01 |
| Manufacturing industry (CZ) | −0.05 | 0.11 | −0.01 | 0.33 | −0.01 |
| raw serie | 0.12 | −0.04 | −0.06 | 0.08 | 0.00 |
| SA-WDA coeff. | −0.17 | 0.15 | 0.05 | 0.25 | −0.01 |
- How to read it: in the manufacturing industry, the SA-WDA variation between June and July 2016 is revised by −0.05 points: +0.12 points are due to the revision of the raw series and −0.17 points to the new calculation of the SA-WDA parameters.
- Source: INSEE
Documentation
Methodology (pdf,140 Ko)
Pour en savoir plus
Time series : Turnover indices (VAT)
