


 30 November 2016
2016- n° 318In October 2016, overall agricultural producer prices increased by 0.2 % over one
year Indices of agricultural prices - October 2016
30 November 2016
2016- n° 318In October 2016, overall agricultural producer prices increased by 0.2 % over one
year Indices of agricultural prices - October 2016
In October 2016, overall agricultural prices slightly rebounded compared to last year : +0.2%, after −0.5% in September. Excluding fruits and vegetables, they increased by 0.9 % over the month but decreased by 0.2% over one year.
In October 2016, overall agricultural prices slightly rebounded compared to last year : +0.2%, after −0.5% in September. Excluding fruits and vegetables, they increased by 0.9 % over the month but decreased by 0.2% over one year.
Over the month, cereals prices picked up, oleaginous ones kept on going up
In October, cereals prices rallied (+2.6% after −2.6% in September), owing to a slight appreciation of the dollar and strong international demand. In absolute terms, they nevertheless remained low because the global supply was abundant. Oleaginous prices kept on rising (+7.7% over three months) due to higher oil price which revived interest in hydrocarbon substitution by rape and to increases in some edible oils as well (palm and soy).
graphiqueGraph1 – Producer prices of cereals
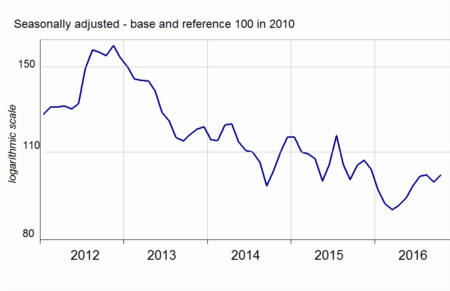
- Source: INSEE
Marked rises in potatoes, fruits, vegetables and wines prices
Potato price was much higher (+32.0%) than in October 2015: bad weather conditions lessened the yields in North-Western Europe.
Overall wine prices were higher than last year (+4.4%), as crops were affected by adverse weather conditions in some areas, such as the Val-de-Loire and Languedoc-Roussillon regions.
Over one year, fruits and vegetables prices increased by 4.1% in October. Noticeably, apples and pears were more expensive, as production retreated, affected by adverse weather.
graphiqueGraph2 – Producer prices of fresh vegetables
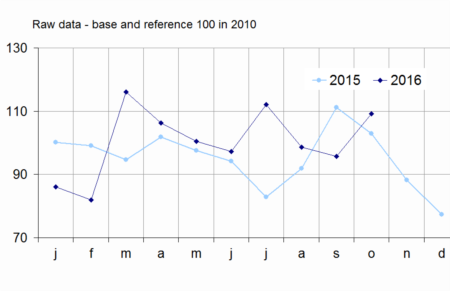
- Source: SSP (ministry in charge of agriculture)
The prices of animals and milk picked up
Animal prices continued to rise in October (+1.2% over one month after +0.6%). Pig prices increased again (+2.6 % over three months ; +8.3% over one year) boosted by a buoyant Asian demand, mainly Chinese. Large cattle prices picked up in October (+2.0 % after −0.2 %) but still significantly fell back over one year (−8.1%) due to a larger amount of dairy cows slaughtering in Europe in relation with the milk crisis.
graphiqueGraph3 – Producer prices of pigs and large cattle
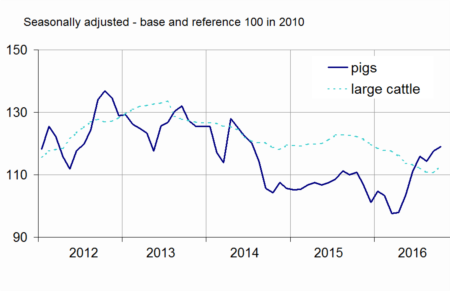
- Source: INSEE
Cow milk price pickep up in the third quarter (+2.7%) but still stepped back by 10.6% from September 2015 to September 2016. This recovery reflects a short-term upturn: the production of the main exporting countries has decreased, while China has driven the global demand upwards.
tableauTable1 – Indices of producer prices of agricultural products (IPPAP)
| Variation as % over | |||||
|---|---|---|---|---|---|
| Weights | Oct. 2016 | a month | 3 months | a year | |
| Agricultural goods output | 1000 | 114.9 | /// | /// | +0.2 |
| excluding fruits and vegetables | 900 | 114.8 | +0.9 | +1.7 | –0.2 |
| Crop output (excluding fruits and vegetables) | 505 | 121.8 | +0.8 | +1.5 | +3.2 |
| Cereals | 188 | 101.2 | +2.6 | +0.5 | –3.5 |
| of which soft wheat | 112 | 98.4 | +1.5 | –0.3 | –2.3 |
| grain maize | 41 | 98.3 | +3.8 | +1.1 | +1.3 |
| Potatoes | 26 | 242.5 | /// | /// | +32.0 |
| Wines | 177 | 135.4 | +0.2 | +0.2 | +4.4 |
| protected designation of origin | 84 | 147.2 | –0.3 | +0.7 | +9.7 |
| other wines | 23 | 140.7 | +3.2 | –2.0 | –5.8 |
| Oleaginous | 49 | 103.5 | +2.6 | +7.7 | +0.7 |
| Horticultural products | 30 | 110.9 | +1.4 | +0.3 | +0.3 |
| Other crop products | 36 | 109.6 | +0.1 | +0.6 | +1.2 |
| Fruits and vegetables (1) | 100 | 115.3 | /// | /// | +4.1 |
| Fresh vegetables | 53 | 109.2 | /// | /// | +6.1 |
| Fresh fruits | 35 | 127.1 | /// | /// | +3.4 |
| Animal output | 395 | 105.9 | +1.0 | +2.1 | –4.8 |
| Animals | 234 | 112.6 | +1.2 | +1.2 | –2.3 |
| of which large cattle | 96 | 112.8 | +2.0 | +0.5 | –8.1 |
| calves | 26 | 103.1 | +0.5 | +0.8 | –2.2 |
| pigs | 54 | 118.9 | +1.1 | +2.6 | +8.3 |
| sheep | 10 | 120.3 | +2.0 | +5.9 | +1.5 |
| poultry | 46 | 109.1 | –0.2 | 0.0 | –2.5 |
| of which chicken | 28 | 108.7 | –0.1 | –0.2 | –3.0 |
| Milk | 147 | 93.9 | /// | +2.5 | –9.7 |
| of which cow milk (2) | 137 | 92.5 | /// | +2.7 | –10.6 |
| Eggs | 15 | 119.9 | +6.4 | +14.8 | –0.3 |
- * Except for fresh fruits, fresh vegetables and potatoes
- /// Absence of result due to the nature of these series
- (1) Including vegetables for industry.
- (2)The September value of cow milk price indice is carried forward in October
- Sources: INSEE, SSP (ministry in charge of agriculture)
Purchase prices of means of production went up over the month and dropped over one year
In October 2016, intermediate consumption prices climbed by 0.4% over one month, mainly due to the rise in energy prices. Over a year inputs prices declined by 3.1%, driven by the sharp fall in fertiliser prices (−16.9%) and by the drop in feed prices (−4.1%). Capital goods prices increased over one month (+0.3%) and over one year (+1.0%).
Revisions
The variation in IPPAP over one year in September 2016 have been raised by 0.4 points and that in IPAMPA by 0.2 points, due to revisions in raw data.
graphiqueGraph4 – Purchase prices of the means of agricultural production
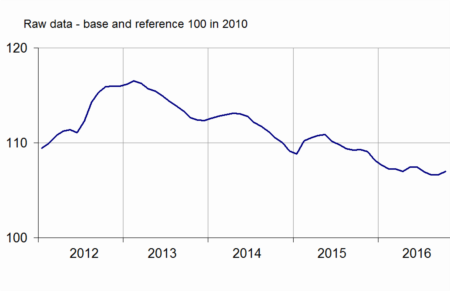
- Sources: INSEE, SSP (ministry in charge of agriculture)
tableauTable2 – Indices of purchase prices of the means of agricultural production (IPAMPA)
| Weights | Oct. 2016 | variation as % over | |||
|---|---|---|---|---|---|
| a month | 3 months | a year | |||
| Total input | 1000 | 107.0 | +0.4 | +0.1 | –2.1 |
| Intermediate consumptions | 764 | 106.8 | +0.4 | –0.1 | –3.1 |
| Energy | 100 | 96.9 | +4.6 | +4.3 | +2.5 |
| Seeds | 57 | 106.3 | –0.7 | –1.0 | –2.7 |
| Fertilisers and soil improvers | 92 | 97.1 | –0.2 | –3.1 | –16.9 |
| Plant protection products | 78 | 100.6 | –0.3 | +0.2 | –0.4 |
| Animal feed | 205 | 111.9 | –0.3 | –0.5 | –4.1 |
| Veterinary expenses | 43 | 118.1 | +0.1 | +0.3 | +2.8 |
| Small equipment and tools | 17 | 109.9 | +0.4 | +0.5 | –0.1 |
| Maintenance of materials | 67 | 113.7 | 0.0 | –0.1 | +0.2 |
| Maintenance of buildings | 9 | 107.8 | 0.0 | +0.1 | +1.1 |
| Other goods and services | 97 | 105.0 | +0.1 | 0.0 | +0.6 |
| Goods and services contributing to investment | 236 | 107.8 | +0.3 | +0.5 | +1.0 |
| Material | 186 | 108.8 | +0.5 | +0.7 | +1.1 |
| Tractors | 79 | 109.0 | +0.6 | +0.6 | +1.5 |
| Machinery and equipment for cultivation | 36 | 110.5 | –0.5 | +0.4 | +0.9 |
| Machinery and equipment for harvesting | 42 | 109.9 | +1.4 | +1.7 | +1.9 |
| Utility vehicles | 18 | 104.1 | –0.2 | –0.2 | –0.5 |
| Buildings | 50 | 104.2 | 0.0 | –0.2 | +0.8 |
- (1) The repayment of the domestic tax on energy product (TICPE) benefiting farmers has been applied in advance for the year 2016
- Sources: INSEE, SSP (ministry in charge of agriculture)
Documentation
Methodology (pdf,122 Ko)
Pour en savoir plus
Time series : Indices of agricultural prices
