


 28 October 2016
2016- n° 284Household consumption expenditure on goods faltered slightly in September (−0.2%)
and decreased by 0.5% over the third quarter Household consumption expenditure on goods - September 2016
28 October 2016
2016- n° 284Household consumption expenditure on goods faltered slightly in September (−0.2%)
and decreased by 0.5% over the third quarter Household consumption expenditure on goods - September 2016
In September 2016, household consumption expenditure on goods declined slightly anew: −0.2% in volume* after +0.8% in August. In particular, consumption of energy fell back and purchases of engineered goods slowed down markedly. Over the third quarter, household consumption expenditure on goods decreased by 0.5% (after +0.1%), with a sharp downturn in household durables and gas-electricity expenses.
- Energy: renewed decline
- Engineered goods: stability in September, decline over the quarter
- Durables: slowdown in September and sharp decline over the quarter
- Textile-clothing: small decline
- Other engineered goods: decrease in September, rebound over the quarter
- Food products: slight improvement in September, rebound over the quarter
- The variation in August 2016 is slightly revised upwards
In September 2016, household consumption expenditure on goods declined slightly anew: −0.2% in volume* after +0.8% in August. In particular, consumption of energy fell back and purchases of engineered goods slowed down markedly. Over the third quarter, household consumption expenditure on goods decreased by 0.5% (after +0.1%), with a sharp downturn in household durables and gas-electricity expenses.

* Volumes are measured at chain-link previous year prices (2010 euro billions) and all figures are trading days and seasonally adjusted.
graphiqueGraph1 – Total consumption of goods
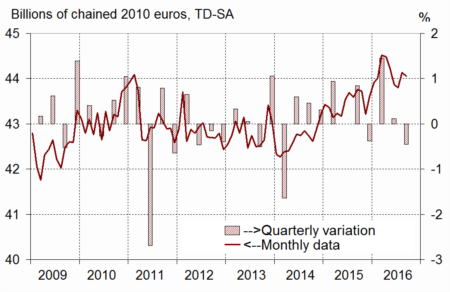
- Source: INSEE
graphiqueGraph2 – Food and engineered goods

- Source: INSEE
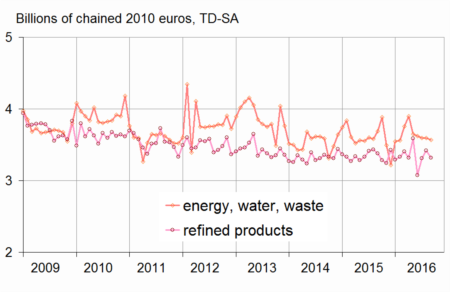
Energy: renewed decline
In September, consumption of energy declined anew (−1.7%), after two months of growth. The donwturn in consumption of refined products contributed the most to this fall (−3.0%), but expenses on gas-electricity also stepped back (−0.7%). Over the whole quarter, consumption of energy retreated clearly (−1.9% after +1.4%), particularly in gas-electricity, as temperatures returned to the norm after a relatively cool spring.
graphiqueGraph3 – Energy
Engineered goods: stability in September, decline over the quarter
In September, purchases of engineered goods were stable after a rebound in August. Over the third quarter, they decreased (−1.1% after +0.2%).
Durables: slowdown in September and sharp decline over the quarter
In September, expenditure on durables slowed down (+0.5% after +1.5% in August); in particular, car purchases came to a standstill (−0.1% after +3.0%). However, expenses on watch-jewellery bounced back strongly. Over the third quarter, purchases of durables decreased clearly (−2.4% after +0.7%). In particular, purchases of household durables fell after two very dynamic quarters.
Textile-clothing: small decline
In September, expenses on textile-clothing fell back (−0.5%), notably the purchases of shoes which dropped strongly. Over the whole quarter, these expenses decreased moderately again (−0.3% after −0.6%).
Other engineered goods: decrease in September, rebound over the quarter
In September, household expenditure on other engineered goods decreased (−0.4%) after two months of [rise]. Over the third quarter, they grew by 0.6% (after 0.0%).
graphiqueGraph4 – Breakdown of engineered goods
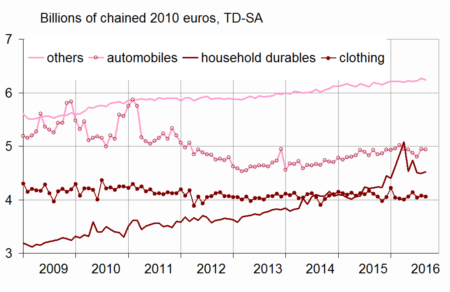
- Source: INSEE
Food products: slight improvement in September, rebound over the quarter
In September, consumption of food products increased modestly (+0.2% after 0.0%). Purchases of agricultural products increased while those of processed agrifood decreased slightly. Over the whole quarter, consumption of food products picked up: +0.9% after −0.6%.
The variation in August 2016 is slightly revised upwards
The variation in household expenditure on goods in August 2016 has been revised upwards by 0.1 points: it now stands at +0.8% instead of +0.7%. Since the previous publication, new information has been integrated, particularly concerning household durables, energy and textile-clothing, moreover, the seasonal adjustment coefficients have been updated.
tableauTable – Household consumption expenditure on goods
| Weight (1) | July 2016 | Aug. 2016 | Sept. 2016 | Sept. 16 / Sept. 15 | Q3 2016/Q2 2016 | |
|---|---|---|---|---|---|---|
| Food products | 38 | 0.6 | 0.0 | 0.2 | 1.5 | 0.9 |
| Engineered goods | 45 | –1.8 | 1.1 | 0.0 | 1.3 | –1.1 |
| - Inc. Durables | 22 | –2.7 | 1.5 | 0.5 | 2.6 | –2.4 |
| - Automobiles | 12 | –1.5 | 3.0 | –0.1 | 0.1 | –0.5 |
| - Household durables | 7 | –5.0 | –0.2 | 0.6 | 7.1 | –5.9 |
| - Inc. Textile-clothing | 9 | –2.4 | 1.0 | –0.5 | –1.3 | –0.3 |
| - Inc. Other engineered goods | 13 | 0.2 | 0.7 | –0.4 | 0.8 | 0.6 |
| Energy | 17 | 2.7 | 1.4 | –1.7 | –2.6 | –1.9 |
| - Inc. Energy, water, waste | 10 | –0.8 | 0.0 | –0.7 | –3.3 | –3.7 |
| - Inc. Refined Products | 8 | 7.6 | 3.3 | –3.0 | –1.7 | 0.7 |
| Total | 100 | –0.1 | 0.8 | –0.2 | 0.7 | –0.5 |
| - Inc. Manufactured goods | 84 | 0.0 | 1.0 | –0.3 | 1.2 | 0,0 |
- (1) Weighting in the consumption expenditure on goods in value in 2015
Documentation
Methodology (pdf,23 Ko)
Pour en savoir plus
