


Quarterly national accounts in Q3 2016 National accounts in base 2010 - Detailed figures
French GDP increased by 0.2% in Q3 2016 Quarterly national accounts - first estimate - third quarter 2016
In Q3 2016, gross domestic product (GDP) in volume terms* recovered: +0.2%, after −0.1% in Q2.
Household consumption expenditure stagnated for the second quarter in a row, whereas gross fixed capital formation (GFCF) increased slightly (+0.3% after 0.0%). All in all, final domestic demand (excluding inventory changes) was virtually stable: it contributed to GDP growth for +0.1 points in Q3, as in the previous quarter.
Imports sharply bounced back (+2.2% after −1.7%). Exports accelerated to a lesser extent (+0.6% after +0.2%). All in all, foreign trade balance contributed negatively to GDP growth (−0.5 points after +0.6 points). Conversely, changes in inventories contributed positively (+0.6 points after −0.8 points).

Erratum : this Informations rapides replaces and supersedes the issue published on 28th october 2016 at 7:30 am. Wages paid by the companies to households are revised upwards by 500M€ in the second quarter of 2016. This revision lowers corporation's profit ratio by 0.2 point for the second quarter of 2016, and increases the households' purchasing power by 0.1 point. The overhang of the housedhold's purchasing power is revised upwards by +0.1 point for 2016. However, figures for the third quarter of 2016 are not revised.
In Q3 2016, gross domestic product (GDP) in volume terms* recovered: +0.2%, after −0.1% in Q2.
Household consumption expenditure stagnated for the second quarter in a row, whereas gross fixed capital formation (GFCF) increased slightly (+0.3% after 0.0%). All in all, final domestic demand (excluding inventory changes) was virtually stable: it contributed to GDP growth for +0.1 points in Q3, as in the previous quarter.
Imports sharply bounced back (+2.2% after −1.7%). Exports accelerated to a lesser extent (+0.6% after +0.2%). All in all, foreign trade balance contributed negatively to GDP growth (−0.5 points after +0.6 points). Conversely, changes in inventories contributed positively (+0.6 points after −0.8 points).
* This growth rate is seasonally and working-day adjusted; volumes are chain-linked previous-year-prices volumes.
graphiqueGraph – GDP and its main components
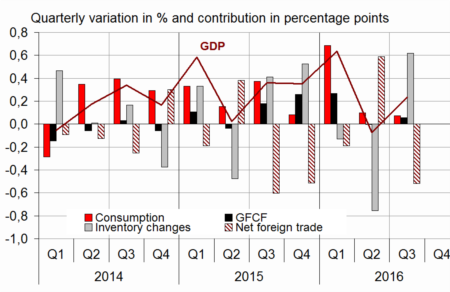
- Source: INSEE
tableauTable1 – Goods and services: supply and uses chain-linked volumes
| 2015 Q4 | 2016 Q1 | 2016 Q2 | 2016 Q3 | 2015 | 2016 (ovhg) | |
|---|---|---|---|---|---|---|
| GDP | 0.4 | 0.6 | -0.1 | 0.2 | 1.2 | 1.1 |
| Imports | 2.3 | 0.3 | -1.7 | 2.2 | 6.4 | 2.7 |
| Household consumption *expenditure | 0.0 | 1.1 | 0.0 | 0.0 | 1.5 | 1.3 |
| General government's *consumption expenditure | 0.4 | 0.4 | 0.4 | 0.4 | 1.4 | 1.5 |
| GFCF | 1.2 | 1.2 | 0.0 | 0.3 | 0.9 | 2.6 |
| *of which Non-financial corporated and unincorporated enterprises | 1.5 | 1.9 | -0.3 | -0.3 | 2.7 | 3.2 |
| Households | 0.4 | 0.3 | 0.4 | 0.8 | -0.8 | 1.3 |
| General government | 1.5 | 0.1 | 0.4 | 1.1 | -3.9 | 2.5 |
| Exports | 0.7 | -0.4 | 0.2 | 0.6 | 6.0 | 0.8 |
| Contributions : | ||||||
| Internal demand excluding inventory changes | 0.3 | 1.0 | 0.1 | 0.1 | 1.3 | 1.6 |
| Inventory changes | 0.5 | -0.1 | -0.8 | 0.6 | 0.2 | 0.1 |
| Net foreign trade | -0.5 | -0.2 | 0.6 | -0.5 | -0.3 | -0.6 |
- Source: Insee
Total production recovered
In Q3 2016, production in goods and services moderately bounced back (+0.4% after −0.2%). It increased in services (+0.6% after 0.0%) and it almost levelled off in goods (−0.1% after −0.7%). Production increased anew in construction (+1.0% after −0.4%). Output in manufactured goods recovered (+0.5% after −1.0%). In particular, it bounced back in coke and refined petroleum industry (+13.7% after −12.8%) after industrial action in May and June. However, output in transport equipment significantly fell back (−3.3% after +1.5%). Energy production shrank (−2.7% after +0.7%).
tableauTable2 – Production, consumption and GFCF: main components
| 2015 Q4 | 2016 Q1 | 2016 Q2 | 2016 Q3 | 2015 | 2016 (ovhg) | |
|---|---|---|---|---|---|---|
| Production of branches | 0.5 | 0.6 | -0.2 | 0.4 | 1.3 | 1.2 |
| Goods | 0.4 | 0.1 | -0.7 | -0.1 | 1.2 | -0.1 |
| Manufactured Industry | 0.7 | 0.0 | -1.0 | 0.5 | 1.5 | 0.1 |
| Construction | 0.6 | 0.3 | -0.4 | 1.0 | -2.2 | 0.6 |
| Market services | 0.6 | 1.0 | -0.1 | 0.6 | 1.8 | 2.0 |
| Non-market services | 0.3 | 0.4 | 0.3 | 0.3 | 1.0 | 1.2 |
| Household consumption | 0.0 | 1.1 | 0.0 | 0.0 | 1.5 | 1.3 |
| Food products | 0.3 | 0.4 | -0.6 | 0.9 | 1.2 | 0.9 |
| Energy | -2.6 | 1.7 | 1.4 | -1.9 | 1.4 | 0.3 |
| Engineered goods | -0.1 | 2.2 | 0.2 | -1.1 | 2.6 | 2.3 |
| Services | 0.3 | 0.7 | -0.2 | 0.3 | 1.0 | 1.2 |
| GFCF | 1.2 | 1.2 | 0.0 | 0.3 | 0.9 | 2.6 |
| Manufactured goods | 3.3 | 2.9 | 0.3 | -2.3 | 2.1 | 5.9 |
| Construction | 0.6 | 0.5 | -0.1 | 0.9 | -2.2 | 1.0 |
| Market services | 0.7 | 1.1 | 0.0 | 1.1 | 4.4 | 2.8 |
- Source: INSEE
Household consumption remained stable
In Q3 2016, household consumption expenditure stagnated again. Expenditures moderately bounced back in services (+0.3% after −0.2%) whereas they declined in goods (−0.5% after +0.1%).
In detail, expenditure on energy fell back in summer after being dynamic in the first half of the year due to temperatures below seasonal norms (−1.9% after +1.4%). Consumption of engineered goods declined (−1.1% after +0.2%), especially household equipment (−5.9%) after two quarters of sharp growth (+7.4% in Q1 and +3.5% in Q2).
By constrast, consumption of food products bounced back (+0.9% after −0.6%).
Household investment accelerated, corporate investment fell again
Global GFCF rose anew in Q3 (+0.3% after 0.0%). Investment in construction increased by 0.9% (after −0.1%), especially in civil engineering. Investment in market services also recovered (+1.1% after 0.0%), particularly in software. Conversely, GFCF in manufactured goods fell back sharply (−2.3% after +0.3%), especially in transport equipment and capital goods.
Foreign trade balance weighed down on GDP growth
In Q3 2016, imports recovered sharply (+2.2% after −1.7%), particularly due to purchases of raw hydrocarbons and transport equipment. At the same time, exports accelerated moderately (+0.6% after +0.2%). Sales in food products, refined petroleum products and other industrial goods increased but those in agricultural products tumbled. All in all, foreign trade balance weighed down on GDP growth in Q3: −0.5 points after +0.6 points in the previous quarter.
The contribution of changes in inventories to GDP growth was positive
In Q3, changes in inventories contributed to GDP growth by +0.6 points, after −0.8 points in Q2. In particular, they increased in transport equipment, raw hydrocarbons and equipment goods.
Revisions
GDP growth estimate for Q2 2016 is confirmed, at −0.1%. For the past quarters, crop product has been lowered, in connection with the preliminary information available on crops, affected by unfavourable weather conditions. Conversely, households' investment is raised, due to a significant revision in the indicator of new housing production.
tableauTable3 – Sectoral accounts
| 2015 Q4 | 2016 Q1 | 2016 Q2 | 2016 Q3 | 2015 | 2016 (ovhg) | |
|---|---|---|---|---|---|---|
| Profit ratio of NFC* (level) | 31.5 | 32.0 | 31.6 | 31.4 | ||
| Household purchasing power | 0.5 | 0.6 | 0.2 | 1.6 | 1.5 |
- *NFC: non-financial corporations
- Source: INSEE
tableauTable4 – Households' disposable income and ratios of households' account
| 2015 Q4 | 2016 Q1 | 2016 Q2 | 2016 Q3 | 2015 | 2016 (ovhg) | |
|---|---|---|---|---|---|---|
| HDI | 0.5 | 0.4 | 0.3 | 1.4 | 1.4 | |
| Household purchasing power | 0.5 | 0.6 | 0.2 | 1.6 | 1.5 | |
| HDI by cu* (purchasing power) | 0.4 | 0.4 | 0.1 | 1.2 | 1.1 | |
| Adjusted HDI (purchasing power) | 0.5 | 0.5 | 0.3 | 1.6 | 1.5 | |
| Saving rate (level) | 14.9 | 14.5 | 14.7 | 14.5 | ||
| Financial saving rate (level) | 5.9 | 5.7 | 5.6 | 5.5 |
- *cu: consumption unit
- Source: INSEE
tableauTable5 – Ratios of non-financial corporations' account
| 2015 Q4 | 2016 Q1 | 2016 Q2 | 2016 Q3 | 2015 | |
|---|---|---|---|---|---|
| Profit share | 31.5 | 32.0 | 31.6 | 31.4 | |
| Investment ratio | 23.0 | 23.2 | 23.3 | 22.9 | |
| Savings ratio | 19.9 | 21.2 | 20.5 | 19.7 | |
| Self-financing ratio | 86.5 | 91.3 | 87.8 | 86.3 |
- Source: INSEE
tableauTable6 – Expenditure, receipts and net borrowing of public administrations
| 2015 Q4 | 2016 Q1 | 2016 Q2 | 2016 Q3 | 2015 | |
|---|---|---|---|---|---|
| In billions of euros | |||||
| Total expenditure | 310.4 | 313.4 | 314.0 | 1242.8 | |
| Total receipts | 295.2 | 295.2 | 297.2 | 1166.3 | |
| Net lending (+) or borrowing (-) | -15.1 | -18.2 | -16.8 | -76.5 | |
| In % of GDP | |||||
| Net lending (+) or borrowing (-) | -2.8 | -3.3 | -3.0 | -3.5 |
- Source: INSEE
Avertissement
Quarterly national accounts
Quarterly debt of the general government
Sources
Quarterly national accounts
Quarterly accounts are a consistent set of indicators which provides a global overview of recent economic activity.
Time series of the main aggregates of quarterly national accounts can be accessed through the "Summary". They are classified into eight categories:
- Gross domestic product (GDP) and main economic aggregates ;
- Goods and services ;
- Households' consumption ;
- Foreign trade ;
- Activities ;
- Institutional sectors ;
- Households' income and purchasing power ;
- Public finances.
For each category, are available :
- synthetic files displaying from the accounts the relevant information for economic analysis ,
- sometimes, one or two files displaying all the data available.
Documentation
Abbreviated methodology (pdf, 140 Ko )
Methodology - First estimate at 30 days (pdf, 112 Ko )