


 25 October 2016
2016- n° 275In October 2016, the business climate declines and returns to its average in retail
trade and in trade and repair of motor vehicles Monthly survey of retailing - October 2016
25 October 2016
2016- n° 275In October 2016, the business climate declines and returns to its average in retail
trade and in trade and repair of motor vehicles Monthly survey of retailing - October 2016
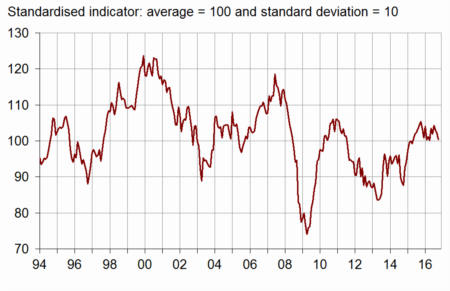
According to the managers surveyed in retail trade and in trade and repair of motor vehicles, the business climate has weakened in October 2016. The composite indicator that measures it has lost two points and has returned to its long term average (100). It has been equal to this average level or above it since May 2015.
According to the managers surveyed in retail trade and in trade and repair of motor vehicles, the business climate has weakened in October 2016. The composite indicator that measures it has lost two points and has returned to its long term average (100). It has been equal to this average level or above it since May 2015.
graphiqueChart_1 – Business climate synthetic indicator
Lower ordering intentions
The balances concerning past and expected sales are practically stable; the first one stands slightly below its average, the second one is at its average. However, more traders than in September expect a fall in their orders: the corresponding balance has declined and has gone below its long-term average again.
The balance concerning general business outlook in whole trade is stable, above its mean level.
Stocks have been estimated higher, while the balance was already above its standard level.
As many retailers as in September expect falls in prices over the next few months.
tableauTable_1 – Tendancy in retail trade and in trade and repair of motor vehicles
| Ave. (1) | July 16 | Aug. 16 | Sept. 16 | Oct. 16 | |
|---|---|---|---|---|---|
| Business climate | 100 | 104 | 103 | 102 | 100 |
| General business outlook | –30 | –18 | –22 | –19 | –19 |
| Recent sales | –7 | –5 | –4 | –11 | –10 |
| Expected sales | –3 | 2 | 0 | –3 | –2 |
| Ordering intentions | –9 | –2 | –3 | –4 | –10 |
| Stocks | 11 | 16 | 14 | 13 | 16 |
| Past selling prices (2) | –7 | –7 | –7 | ||
| Expected selling prices | –3 | –5 | –5 | –8 | –8 |
| Cash position (2) | –15 | –16 | –18 | ||
| Workforce size: recent trend | 1 | –4 | –1 | –1 | –5 |
| Workforce size: future trend | –3 | –3 | –4 | –6 | –5 |
- (1) Average since 1991 (2004 for recent and expected sales and ordering intentions).
- (2) Bi-monthly question (odd-numbered months).
- Source: INSEE - monthly survey in retail trade and in trade and repair of motor vehicles
graphiqueChart_2 – Recent sales and ordering intentions

Still pessimistic employment prospects
The balance concerning the recent workforce size has decreased and the expected workforce one is virtually stable: each of them stands below its average. In retail trade, these two balances remain below their mean level, while in trade and repair of motor vehicles, they stay above normal.
In retail trade, the business climate has worsened
In retail trade, the business climate indicator has declined again: it has lost two points and has reached 97, deviating from its long-term average.
The balance concerning past activity is practically stable in non-specialised trade as in specialised one. In non-specialised trade, the balance is at its mean level. In specialised trade, it is very low, particularly in the “clothing” and “culture, recreational and luxury goods” sectors.
For the months ahead, retailers are overall more pessimistic than in September: the balances concerning expected sales and ordering intentions have fallen, moderately for the first one, significantly for the second one. In particular, the balance on ordering intentions has plummeted in non-specialised trade.
More non-specialised traders than in September foresee to reduce their prices in the next few months. In specialised trade, they are practically as numerous as last month.
In trade and repair of motor vehicles, business climate is practically stable, above normal
In trade and repair of motor vehicles and motor cycles, the business climate indicator is practically stable: it has gained one point to 108. It has remained above its mean level since the end of 2014.
The past sales balance is stable. Prospects are optimistic: the balances concerning expected sales and ordering intentions have risen, significantly for the first one, more slightly for the second one. Each of the three balances was already above its mean level.
More motor vehicle traders than in September expect increases in selling prices.
graphiqueChart_3 – Recent sales and ordering intentions in trade and repair of motor vehicles

graphiqueChart_4 – Business climate synthetic indicator in retail trade and in trade and repair of motor vehicles

tableauTable_2 – Detailed data
| Ave. (1) | July 16 | Aug. 16 | Sept. 16 | Oct. 16 | |
|---|---|---|---|---|---|
| Retail trade - Global data | |||||
| Business climate | 100 | 99 | 100 | 99 | 97 |
| Gener. busin. outlook | –30 | –21 | –24 | –21 | –22 |
| Recent sales | –6 | –14 | –11 | –14 | –13 |
| Expected sales | –1 | 0 | –2 | –3 | –7 |
| Ordering intentions | –7 | –5 | –5 | –5 | –14 |
| Stocks | 10 | 16 | 12 | 11 | 16 |
| Past selling prices (2) | –9 | –11 | –9 | ||
| Expected selling prices | –5 | –6 | –7 | –7 | –10 |
| Cash position (2) | –13 | –16 | –18 | ||
| Workforce size: recent trend | 2 | –5 | –2 | –1 | –4 |
| Workforce size: future trend | –2 | –4 | –4 | –6 | –5 |
| Non-specialised retail trade | |||||
| Recent sales | –2 | –8 | –8 | –2 | –1 |
| Expected sales | 6 | 9 | 6 | 4 | –1 |
| Ordering intentions | 1 | 5 | 4 | 5 | –9 |
| Stocks | 7 | 14 | 10 | 9 | 17 |
| Past selling prices (2) | –9 | –13 | –9 | ||
| Expected selling prices | –5 | –5 | –6 | –6 | –9 |
| Cash position (2) | –7 | –9 | –11 | ||
| Specialised retail trade | |||||
| Recent sales | –11 | –21 | –14 | –27 | –28 |
| Expected sales | –8 | –9 | –10 | –15 | –14 |
| Ordering intentions | –17 | –15 | –16 | –16 | –20 |
| Stocks | 13 | 15 | 11 | 12 | 15 |
| Past selling prices (2) | –8 | –9 | –9 | ||
| Expected selling prices | –5 | –8 | –8 | –9 | –10 |
| Cash position (2) | –23 | –24 | –27 | ||
| Trade and repair of motor cars and motorcycles | |||||
| Business climate | 100 | 114 | 110 | 107 | 108 |
| Gener. busin. outlook | –29 | –8 | –15 | –12 | –12 |
| Recent sales | –9 | 17 | 12 | –4 | –3 |
| Expected sales | –7 | 4 | 8 | –3 | 10 |
| Ordering intentions | –12 | 7 | 2 | –6 | –2 |
| Stocks | 15 | 18 | 19 | 18 | 17 |
| Past selling prices (2) | 1 | 1 | –3 | ||
| Expected selling prices | 4 | –2 | 3 | –6 | 1 |
| Cash position (2) | –24 | –16 | –18 | ||
| Workforce size: recent trend | –9 | 0 | 0 | 3 | –6 |
| Workforce size: future trend | –7 | –1 | –6 | –6 | –2 |
- (1) Average since 1991 (2003 for trade and repair of motor vehicles and 2004 for recent and expected sales and ordering intentions).
- (2) Bi-monthly question (odd-numbered months).
- Source: INSEE - monthly survey in retail trade and in trade and repair of motor vehicles
Documentation
Methodology (pdf,129 Ko)
Pour en savoir plus
