


 25 October 2016
2016- n° 274In October 2016, the business climate declines slightly in services Monthly survey of services - October 2016
25 October 2016
2016- n° 274In October 2016, the business climate declines slightly in services Monthly survey of services - October 2016
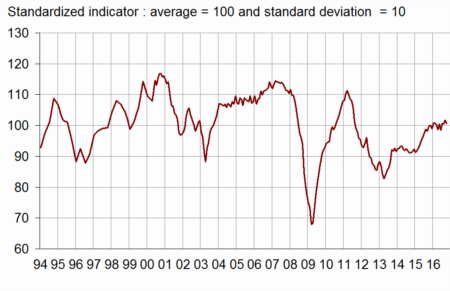
According to business managers surveyed in October 2016, the business climate in services has declined slightly. The composite indicator which measures it has decreased by one point (101) but remains slightly above its long-term average (100).
- The expectations on activity and demand have declined
- The business climate remains favourable in road transport
- The business climate remains deteriorated in accommodation and food service activities
- In information and communication, the business climate remains close to the average
- The real estate business climate is almost unchanged
- The business climate is virtually stable in professional, scientific and technical activities
- In administrative and support service activities, the business climate is steady
According to business managers surveyed in October 2016, the business climate in services has declined slightly. The composite indicator which measures it has decreased by one point (101) but remains slightly above its long-term average (100).
graphiqueGraph1 – Business climate composite indicator
The turning point indicator has deacreased slightly and stands in the unfavourable area.
graphiqueGraph2 – Turning point indicator
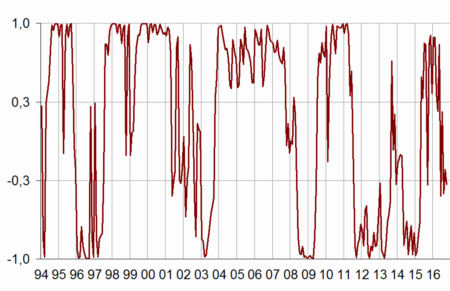
- Note: close to 1 (respectively −1), this indicator indicates a favourable short-term economic situation (respectively unfavourable). Between +0.3 and −0.3: uncertainty area.
The expectations on activity and demand have declined
The balance of opinion on past activity is stable, below its long-term average. Slightly more business leaders than in September expect a decrease in activity and demand for the coming months. However, the balance of opinion on the general outlook, which relates the assessment of business leaders over their whole sector, has gone up; it stands above its long-term average.
The balance of opinion on the past operating balance is unchanged compared with July, close to its long-term average. The balance on expected operating result has increased and is now above its long-term average.
The balance on past employment has gone up, whereas that on expected employment has decreased slightly. Both balances stand clearly above their long-term average.
tableauTable1 – Economic outlook in the services sector
| Average* | July 16 | Aug. 16 | Sept. 16 | Oct. 16 | |
|---|---|---|---|---|---|
| Composite indicator | 100 | 101 | 101 | 102 | 101 |
| General outlook | –8 | –6 | –8 | –7 | –5 |
| Past activity | 2 | –2 | 0 | –3 | –3 |
| Expected activity | 2 | 1 | 1 | 2 | –1 |
| Expected demand | –1 | –1 | –1 | 2 | 0 |
| Past selling prices | –4 | –8 | –4 | –4 | –6 |
| Expected selling prices | –3 | –5 | –6 | –4 | –7 |
| Past employment | 3 | 9 | 8 | 8 | 11 |
| except temporary work agencies | 1 | 3 | 2 | 3 | 4 |
| Expected employment | 2 | 9 | 10 | 11 | 9 |
| except temporary work agencies | –1 | 4 | –1 | 6 | 5 |
| Investments | |||||
| Past investments | 1 | 2 | 4 | 5 | 7 |
| Expected investments | 1 | 7 | 6 | 4 | 3 |
| Operating balance result | |||||
| Past result | –2 | –3 | –3 | ||
| Expected result | –2 | –2 | 2 | ||
| Cash position | –11 | –9 | –8 | ||
| Difficulties of supply and demand | |||||
| difficulties of supply and demand | 10 | 10 | 9 | ||
| difficulties of supply only | 22 | 23 | 22 | ||
| difficulties of demand only | 32 | 34 | 35 | ||
| Difficulties in recruitment | 27 | 24 | 24 |
- * Average since 1989 for the composite indicator and since 1988 for the balances of opinion
- Source: Insee, business survey in services
In all sub-sectors, the business climates are virtually stable. The indicators stand close to their long-term average, except in road transport where it is above (104) and in accomodation and food service activities where it is below (97).
The business climate remains favourable in road transport
In road transport, the business climate is virtually stable in October (104), above its long-term average. In particular, the balances on past activity, expected employment and general outlook have increased and stand far above their long-term average.
The business climate remains deteriorated in accommodation and food service activities
In accommodation and food service activities, the business climate is almost unchanged (97), below its long-term average. The balances on activity have decreased, but those on employment have gone up. The balance on general outlook remains well below its long-term average.
In information and communication, the business climate remains close to the average
In information and communication, the business climate is virtually stable (101), slightly above its long-term average. The expectations on activity and demand have deteriorated; the balance on expected activity has deviated further from its long-term average. However, the balances on employment stand above their long-term average.
The real estate business climate is almost unchanged
In real estate, the business climate is almost unchanged (101), slightly above its long-term average. The balances on expected activity and employment have gone down but the balance on general outlook has improved markedly.
The business climate is virtually stable in professional, scientific and technical activities
In professional, scientific and technical activities, the business climate is almost stable (99), close to its long-term average. The balances on past and expected activity have decreased slightly again and stand below their long-term average.
In administrative and support service activities, the business climate is steady
In administrative and support service activities, the business climate has been stable at 101 since July 2016, slightly above its long-term average. The balance on past activity is almost unchanged, below its long-term average. The balances on employment remain well above their long-term average, particularly because of temporary work agencies, despite a decrease in the balance on expected employment.
tableauTable2 – Business climate composite indicator and balances of opinion by sub-sector in services
| Aggregated classification (NA 2008) at level A21 | Mean* | July 16 | Aug. 16 | Sept. 16 | Oct. 16 |
|---|---|---|---|---|---|
| Road transport (8%) | |||||
| Composite indicator | 100 | 104 | 103 | 103 | 104 |
| Past activity | –8 | –9 | –3 | –4 | –1 |
| Expected activity | –9 | –3 | –4 | –8 | –8 |
| Expected demand | –12 | –1 | –6 | –6 | –7 |
| Past employment | –8 | –4 | 1 | 0 | 0 |
| Expected employment | –10 | –10 | –8 | –4 | 0 |
| General outlook | –24 | –13 | –19 | –13 | –7 |
| Accomodation and food service activities (11%) | |||||
| Composite indicator | 100 | 100 | 89 | 98 | 97 |
| Past activity | –7 | –12 | –14 | –13 | –15 |
| Expected activity | –8 | –4 | –18 | –5 | –8 |
| Expected demand | –10 | –10 | –19 | –12 | –11 |
| Past employment | –4 | 1 | –5 | –6 | –2 |
| Expected employment | –6 | 2 | –4 | –1 | 0 |
| General outlook | –14 | –20 | –31 | –23 | –23 |
| Information and communication (24%) | |||||
| Composite indicator | 100 | 98 | 100 | 102 | 101 |
| Past activity | 8 | –20 | 1 | –4 | –4 |
| Expected activity | 9 | 4 | 8 | 5 | –2 |
| Expected demand | 10 | 9 | 8 | 18 | 13 |
| Past employment | 6 | 4 | 4 | 3 | 11 |
| Expected employment | 10 | 10 | 9 | 18 | 18 |
| General outlook | 0 | –1 | 0 | –3 | –1 |
| Real estate activities (13%) | |||||
| Composite indicator | 100 | 102 | 103 | 102 | 101 |
| Past activity | 7 | 14 | 11 | 4 | 6 |
| Expected activity | 8 | 11 | 9 | 16 | 11 |
| Expected demand | 1 | 2 | 2 | –1 | 0 |
| Past employment | 3 | 1 | 10 | 5 | 7 |
| Expected employment | 2 | 4 | 1 | 7 | 4 |
| General outlook | –2 | 0 | 1 | –2 | 3 |
| Professional, scientific and technical activities (24%) | |||||
| Composite indicator | 100 | 100 | 103 | 100 | 99 |
| Past activity | –1 | 4 | –2 | –3 | –4 |
| Expected activity | –2 | –3 | 0 | –4 | –6 |
| Expected demand | –6 | –8 | –2 | –4 | –7 |
| Past employment | 1 | 3 | 1 | –3 | –2 |
| Expected employment | 0 | 4 | 4 | 8 | 5 |
| General outlook | –9 | –9 | –5 | –7 | –5 |
| Administrative and support service activities (18%) | |||||
| Composite indicator | 100 | 101 | 101 | 101 | 101 |
| Past activity | 6 | 9 | 6 | 0 | –1 |
| Expected activity | 5 | –1 | 4 | 6 | 4 |
| Expected demand | 3 | 2 | 4 | 1 | 2 |
| Past employment | 9 | 26 | 20 | 23 | 27 |
| Expected employment | 7 | 19 | 25 | 22 | 17 |
| General outlook | –5 | 0 | –5 | –3 | –2 |
- The figures in parentheses indicate the weights used to aggregate the sub-sector balances of opinion.
- *Composite indicators : average since 1989 (2006 for road transport); balances of opinion : average since 1988 (2006 for road transport)
- Source: INSEE, business survey in services.
Documentation
Methodology (2016) (pdf,158 Ko)
Pour en savoir plus
Time series : Economic outlook surveys – Services
