


 29 July 2016
2016- n° 202In July 2016, consumer prices increased by 0.2% year-on-year Consumer price index - provisional results - July 2016
29 July 2016
2016- n° 202In July 2016, consumer prices increased by 0.2% year-on-year Consumer price index - provisional results - July 2016
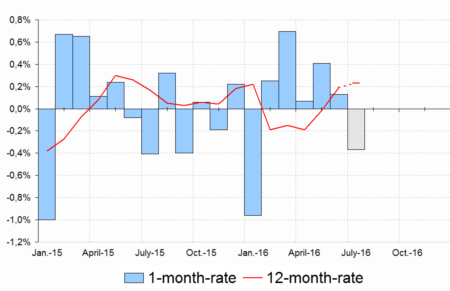
In July 2016, according to the provisional estimate made at the end of the month, the Consumer Price Index (CPI) is set to decrease by 0.4% month-on-month, as in July 2015. This decline should be mainly due to summer sales, underlying the seasonal fall in prices of manufactured products, in particular items of clothing and footwear. Furthermore, energy prices should diminish again because of petroleum products. Conversely, prices of some services related to tourism are likely to rise seasonally in July. Finally, food prices should be almost stable.
In July 2016, according to the provisional estimate made at the end of the month, the Consumer Price Index (CPI) is set to decrease by 0.4% month-on-month, as in July 2015. This decline should be mainly due to summer sales, underlying the seasonal fall in prices of manufactured products, in particular items of clothing and footwear. Furthermore, energy prices should diminish again because of petroleum products. Conversely, prices of some services related to tourism are likely to rise seasonally in July. Finally, food prices should be almost stable.
Year-on-year, consumer prices should grow by 0.2%, as in June 2016. Indeed, the slight slowdown in services prices should be partially offset by a lower downturn for clothing and footwear prices.
In July 2016, the Harmonised Index of Consumer Prices is set to grow by 0.4% over the month. Year-on-year, it should expand by 0.4% after +0.3% in the previous month.

Warning: These provisional results are only preliminary data. Accordingly, they should not be used for contractual revaluations. The indices published here are based on a limited set of price observations and from estimates of some rates of change for fares which are not yet available. The complete results will be published on 11 August 2016.
tableautableauFE_English – Consumer price index
| Weight 2016 | July 2015 | June 2016 | July 2016 (p) | |
|---|---|---|---|---|
| CPI - All items* | 10000 | 0.2 | 0.2 | 0.2 |
| Food | 1615 | 0.4 | 0.6 | 1.2 |
| - Fresh food | 217 | 4.6 | 3.5 | 8.3 |
| - Other food products | 1398 | −0.2 | 0.1 | 0.1 |
| Tobacco | 195 | 0.3 | 0.0 | 0.1 |
| Energy | 773 | −4.1 | −3.1 | −3.3 |
| Manufactured products | 2651 | −0.9 | −0.5 | −0.3 |
| Services | 4766 | 1.4 | 1.0 | 0.8 |
| HICP** - All items | 10000 | 0.2 | 0.3 | 0.4 |
- (p) provisional results
graphiqueGraphiqueFE_English – Variations of the consumer price index
- *: Consumer Price Indices
- **: Harmonised Index of Consumer Prices
- Geographical coverage: metropolitan France excluding Mayotte
- Source: INSEE - Consumer Price Indexe
Documentation
Methodology (pdf,141 Ko)
Pour en savoir plus
