


 30 June 2016
2016- n° 169In May, household consumption expenditure on goods diminished (−0.7%) Household consumption expenditure on goods - May 2016
30 June 2016
2016- n° 169In May, household consumption expenditure on goods diminished (−0.7%) Household consumption expenditure on goods - May 2016
In May 2016, household consumption expenditure on goods diminished : -0.7% in volume*, after a virtual stability in April (-0.1%). Expenditure on household durables fell, as well as heating one. The rebound in food and textile-clothing consumption mitigated the overall decline.
In May 2016, household consumption expenditure on goods diminished : −0.7% in volume*, after a virtual stability in April (−0.1%). Expenditure on household durables fell, as well as heating one. The rebound in food and textile-clothing consumption mitigated the overall decline.
Engineered goods: decreasing
In May, purchases of engineered goods decreased clearly (−1.5% after +0.5%). This fall stemmed from the strong decline in durables purchases. It was dampened by the rebound in textile-clothing purchases.
graphiquegraph1_new_ang – Total consumption of goods
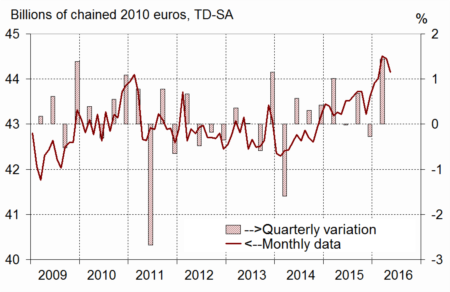
- Source: INSEE
Durables: steep downturn
In May, consumption of durables fell back strongly (−3.6% after +1.2%). After three months of sustained rise, purchases of household durables plummeted (−9.2%). In particular, expenditure on consumer electronic products slipped back after four months of double-digit growth as a result of the change in the standard television brodcasting. Similarly, purchases of furniture withdrew strongly. Car purchases diminished again (−0.3% after −0.9%), mainly because of the decline in second-hand car purchases.
graphiquegraph2_new_ang – Food and engineered goods
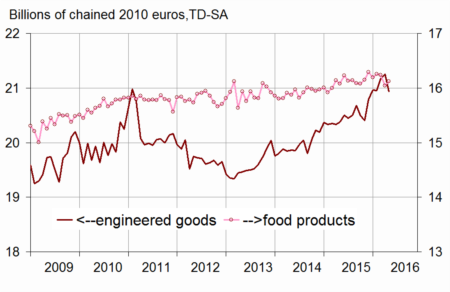
- Source: INSEE
Textile-clothing: rebounding
In May, expenses on textile-clothing recovered (+1.7%) after three consecutive months of decline. Purchases of shoes contributed mostly to this rebound.
Other engineered goods: stability
In May, household expenditure on other engineered goods was stable.

* Volumes are chained and all figures are trading days and seasonally adjusted.
graphiquegraph4_new_ang – Breakdown of engineered goods
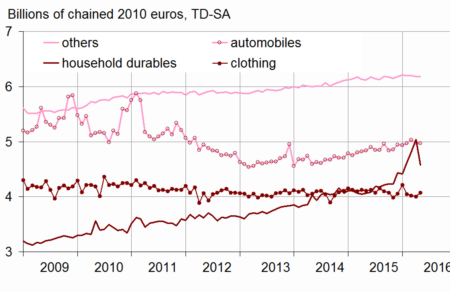
- Source: INSEE
Energy: slight decline
In May, total consumption of energy slipped back (−1.0% after +0.8%), as a result of two opposite trends. Expenditure on gas and electricity fell strongly (−6.8% after +3.3%) after two months during which heating costs had been significant. However, purchases of refined products increased fast (+7.3% after −2.6%), fuel consumption being presumably boosted by precautionary purchases during the social movements in the end of May.
graphiquegraph3_new_ang – Energy
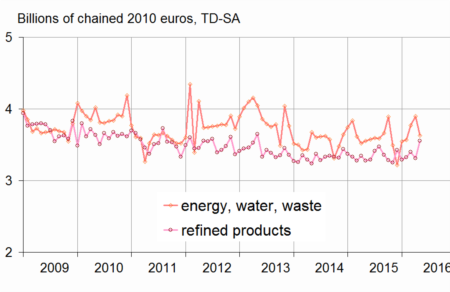
- Source: INSEE
Food products: recovering slightly
Consumption of food products recovered in May (+0.5%), after a significant decline in April (−1.2%). Expenditure bounced back in all processed agrifood, and more particularly in tobacco and meat products.
tableautab1_eng – Household consumption expenditure on goods
| Weight (1) | Mar. 2016 | Apr. 2016 | May 2016 | May 16 / May 15 | Q / Q-1 (2) | |
|---|---|---|---|---|---|---|
| Food products | 38 | –0.1 | –1.2 | 0.5 | 0.2 | –0.7 |
| Engineered goods | 45 | 1.0 | 0.5 | –1.5 | 2.7 | 1.0 |
| - Inc. Durables | 22 | 2.2 | 1.2 | –3.6 | 5.4 | 2.8 |
| - Automobiles | 12 | 1.1 | –0.9 | –0.3 | 2.7 | 0.9 |
| - Household durables | 7 | 4.1 | 4.7 | –9.2 | 12.6 | 7.1 |
| - Inc. Textile-clothing | 9 | –0.5 | –0.4 | 1.7 | –0.9 | –1.7 |
| - Inc. Other engineered goods | 13 | 0.0 | –0.2 | 0.0 | 0.9 | –0.1 |
| Energy | 17 | 4.3 | 0.8 | –1.0 | 4.8 | 6.1 |
| - Inc. Energy, water, waste | 10 | 5.8 | 3.3 | –6.8 | 2.1 | 9.4 |
| - Inc. Refined Products | 8 | 2.3 | –2.6 | 7.3 | 8.3 | 2.3 |
| Total | 100 | 1.1 | –0.1 | –0.7 | 2.2 | 1.2 |
| - Inc. Manufactured goods | 84 | 0.8 | –0.4 | 0.2 | 2.6 | 0.6 |
- (1) Weighting in the consumption expenditure on goods in value
- (2) Last three months / previous three months
The variation in April 2016 remains unchanged
Since the previous publication, new information has been integrated, and the seasonal adjustment coefficients have been updated. However, the variation in household consumption of goods in April 2016 remains unchanged (−0.1%).
Documentation
Methodology (pdf,23 Ko)
Pour en savoir plus
