


 14 September 2016
2016- n° 238In August 2016, prices of frequently purchased goods edged up in hyper and supermarkets
(+0.1%) Price Index in large and predominantly-food stores - August 2016
14 September 2016
2016- n° 238In August 2016, prices of frequently purchased goods edged up in hyper and supermarkets
(+0.1%) Price Index in large and predominantly-food stores - August 2016
In August 2016, prices of frequently purchased goods picked up slightly in hyper and supermarkets (+0.1%) after two months of decline. The increase was slightly stronger in large and predominantly food stores (+0.2%).
In August 2016, prices of frequently purchased goods picked up slightly in hyper and supermarkets (+0.1%) after two months of decline. The increase was slightly stronger in large and predominantly food stores (+0.2%).
Excluding hyper and supermarkets, prices of frequently purchased goods grew modestly again (+0.1%), as in the previous two months.
Considering all the kinds of stores, prices of frequently purchased goods edged up (+0.1%), after four months of stability.
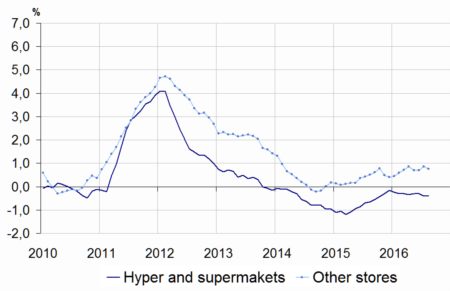
Year-on-year, prices declined again in hyper and supermarkets
Compared with the same month last year, prices of frequently purchased goods sold in hyper and supermarkets went down again in August (−0.4%, as in July). The drop was slightly less strong in large and predominantly food stores (−0.3%, after −0.4%).
By contrast, prices of frequently purchased goods continued to rise in the other kinds of stores (+0.8% year-on-year), albeit at a slightly slower pace than in July (+0.9%).
Considering all stores, prices of frequently purchased goods slid by 0.1% year-on-year for the fourth month in a row.
graphiqueGraphique1English – Frequently purchased goods price indices year-on-year change %
- Geographical coverage: metropolitan France
- Source: INSEE - Consumer Price Indices
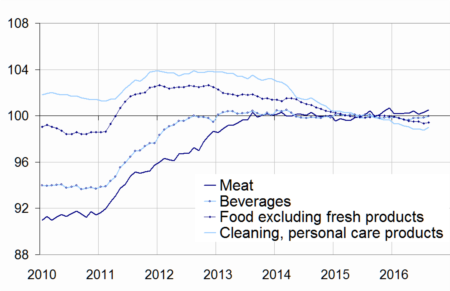
graphiqueGraphique2English – Frequently purchased goods price indices
- Geographical coverage: metropolitan France
- Source: INSEE - Consumer Price Indices
tableauTableau1English – Prices of frequently purchased goods
| Index | Changes (%) compared to | ||
|---|---|---|---|
| August 2016 | last month (m-o-m) | 12 months before (y-o-y) | |
| Hyper and supermarkets (A) | 99.69 | 0.1 | −0.4 |
| Large and predominantly food stores (A + neighborhood stores) | 99.74 | 0.2 | −0.3 |
| Other stores | 100.92 | 0.1 | 0.8 |
| All stores | 99.99 | 0.1 | −0.1 |
- Geographical coverage: metropolitan France
- Source: INSEE - Consumer Price Indices
tableauTableau2English – Prices of frequently purchased goods detailed by main items
| Index | Changes (%) compared to | ||
|---|---|---|---|
| August 2016 | Last month (m-o-m) | 12 months before (y-o-y) | |
| Food and beverages (excluding fresh foodstuffs) | 99.83 | 0.1 | −0.2 |
| - Meat | 100.53 | 0.2 | 0.1 |
| - Beverages | 99.96 | 0.1 | −0.1 |
| - Other food products | 99.42 | 0.1 | −0.5 |
| Clearing and personal care products | 99.00 | 0.2 | −1.0 |
| Total Hyper and supermarkets | 99.69 | 0.1 | −0.4 |
- Geographical coverage: metropolitan France
- Source: INSEE - Consumer Price Indices
Slight rise in food prices in hyper and supermarkets
In August 2016, prices of food excluding fresh products sold in hyper and supermarkets went up slightly (+0,1%), after a stability in the previous month. Year-on-year, they declined by 0.2%, after −0.3% in July.
All kind of products became a little more expansive from the previous month. Meat prices increased by 0.2%, as in July. Year-on-year, they rose by 0.1% after +0,2% both in June and July.
Prices of beverages sold in hyper and supermarkets went up by 0.1% after two months of stability. Year-on-year, they dipped by 0.1%, after −0.2% in July.
Prices of other food products (excluding fresh food) recovered slightly in August (+0.1% after −0,2% in July). Year-on-year, they continued to diminish (−0.5% as in July). However, their decrease eased compared to August 2015, where they had fallen by 1.0% over one year.
Slight rebound in prices of cleaning and personal care products in hyper and supermarkets
In August, the prices of cleaning and personal care products sold in hyper and supermarkets picked up (+0.2%), after a slight fall in July (−0.1%). Year-on-year, they declined again (−1.0%), but less than in the previous month (−1.1%). In August 2015, their fall was more pronounced year-on-year (−1.5%).
Pour en savoir plus
