


 30 September 2016
2016- n° 254Household consumption expenditure on goods bounced back in August 2016 (+0.7%) Household consumption expenditure on goods - August 2016
30 September 2016
2016- n° 254Household consumption expenditure on goods bounced back in August 2016 (+0.7%) Household consumption expenditure on goods - August 2016
In August 2016, household consumption expenditure on goods bounced back: they rose by 0.7% in volume*, after four consecutive months of decline (-0.3% in July). In particular, car purchases edged up and expenditure on fuel grew again.
In August 2016, household consumption expenditure on goods bounced back: they rose by 0.7% in volume*, after four consecutive months of decline (−0.3% in July). In particular, car purchases edged up and expenditure on fuel grew again.
Engineered goods: increasing anew
In August, purchases of engineered goods increased anew (+0.9%) after a sharp decline in July (−1.7%).
graphiquegraph1_new_ang – Total consumption of goods
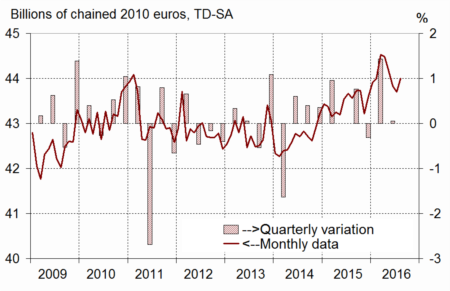
- Source: INSEE
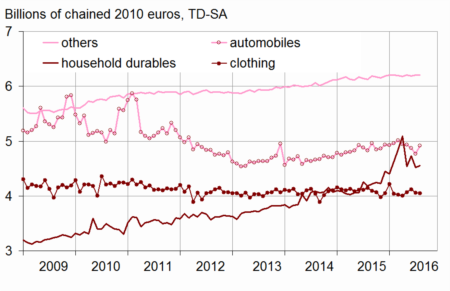
Durables: marked rebound
In August, expenditure on durables bounced back markedly (+1.9%), after a substantial drop in July (−2.8%). In particular, car purchases surged (+3.1%), especially in new cars, after four consecutive months of decline. To a lesser extent, expenditure on household durables picked up after a strong decline in July (−4.5%).
Textile-clothing: virtually stable
In August, expenses on textile-clothing were virtually stable (–0.1%) after a significant drop in July (–1.6%).
Other engineered goods: stability
Household expenditure on other engineered goods was flat in August (after +0.3% in July). In particular, expenses on hardware fell again while perfume purchases kept on growing.

* Volumes are measured at chain-link previous year prices (2010 euro billions) and all figures are trading days and seasonally adjusted.
graphiquegraph3_new_ang – Breakdown of engineered goods
- Source: INSEE
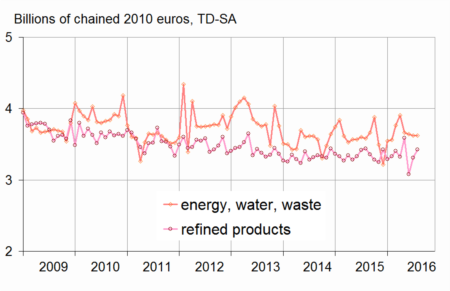
Energy: further rise
In August, consumption of energy grew again (+1.5% after +2.7% in July), especially in refined products (+3.5% after +7.6% in July), in particular in oil and diesel. Furthermore, expenses on electricity and gas levelled off after three months of decline.
Food products: stability
Consumption of food products was stable in August, after being virtually stable in July (+0.1%). In detail, expenditure on agricultural goods decreased again, while consumption of processed agrifood went on rising, notably that of dairy products and tobacco.
graphiquegraph4_new_ang – Energy
- Source: INSEE
graphiquegraph2_new_ang – Food and engineered goods
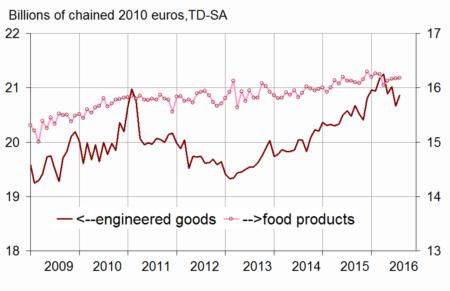
- Source: INSEE
The variation in July 2016 is slightly revised downwards
The variation in household expenditure on goods in July 2016 has been revised downwards by 0.1 points: it now stands at −0.3% instead of −0.2%. Since the previous publication, new information has been integrated, particularly concerning household durable, energy and textile, moreover the seasonal adjustment coefficients have been updated.
tableautab1_eng – Household consumption expenditure on goods
| Weight (1) | June 2016 | July 2016 | Aug. 2016 | Aug. 16 / Aug. 15 | Q/Q-1 (2) | |
|---|---|---|---|---|---|---|
| Food products | 38 | 0.2 | 0.1 | 0.0 | 0.3 | 0.2 |
| Engineered goods | 45 | 0.6 | –1.7 | 0.9 | 1.9 | –1.2 |
| - Inc. Durables | 22 | 0.8 | –2.8 | 1.9 | 4.0 | –2.9 |
| - Automobiles | 12 | –1.3 | –2.1 | 3.1 | 1.8 | –2.2 |
| - Household durables | 7 | 4.2 | –4.5 | 0.9 | 8.9 | –4.7 |
| - Inc. Textile-clothing | 9 | 1.4 | –1.6 | –0.1 | –2.2 | 1.1 |
| - Inc. Other engineered goods | 13 | –0.3 | 0.3 | 0.0 | 1.4 | 0.1 |
| Energy | 17 | –6.7 | 2.7 | 1.5 | 0.3 | –4.4 |
| - Inc. Energy. water. waste | 10 | –0.5 | –0.6 | 0.1 | 1.1 | –4.0 |
| - Inc. Refined Products | 8 | –14.2 | 7.6 | 3.5 | –0.4 | –4.8 |
| Total | 100 | –0.8 | –0.3 | 0.7 | 1.0 | –1.2 |
| - Inc. Manufactured goods | 84 | –1.1 | 0.0 | 1.0 | 1.6 | –0.9 |
- (1) Weighting in the consumption expenditure on goods in value
- (2) Last three months / previous three months
- Source: INSEE
Documentation
Methodology (pdf,23 Ko)
Pour en savoir plus
