


 8 September 2016
2016- n° 234In Q2 2016, prices of second hand housing rose year-on-year, and the volume of transactions
expanded again Indexes of prices of second-hand dwellings - 2nd Quarter 2016
8 September 2016
2016- n° 234In Q2 2016, prices of second hand housing rose year-on-year, and the volume of transactions
expanded again Indexes of prices of second-hand dwellings - 2nd Quarter 2016
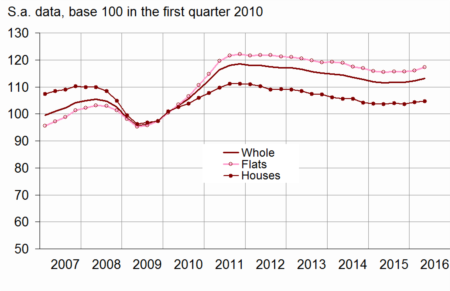
In Q2 2016, prices of second-hand dwellings were stable compared to Q1 2016 (according to provisional results, s.a. data), after three quarters of slight increase. This stability was the result of contrasting situations: prices of flats increased (+0.5%), while prices of houses, more erratic, decreased slightly (-0,3%).
In Q2 2016, prices of second-hand dwellings were stable compared to Q1 2016 (according to provisional results, s.a. data), after three quarters of slight increase. This stability was the result of contrasting situations: prices of flats increased (+0.5%), while prices of houses, more erratic, decreased slightly (−0,3%).
For the second quarter in a row, prices of second-hand dwellings increased over a year: +0.7% compared to Q2 2015. This slight recovery followed a period of price erosion since mid-2012. It concerned houses (+0.9%), and also, for the first time in four years, flats (+0.6%).
In Île-de-France, prices of second-hand dwellings kept recovering
In Q2 2016, prices of second-hand dwellings in Île-de-France rose for the second quarter in a row (+0.8% compared to Q1 2016, after +0.5%).
Year-on-year, prices continued to rally: +1.4% between Q2 2015 and Q2 2016, after +0.2% y-o-y in Q1 and −0.9% in Q4. The revival concerned both houses (+1.2% y-o-y) and flats (+1.5%).
In provincial France, prices decreased q-o-q, but still increased y-o-y
In provincial France, prices of second-hand dwelling edged down between the first and the second quarter 2016 (−0.3%) after three quarters of slight increase.
Prices remained, however, higher than one year before (+0.5%), after a small rebound at the beginning of 2016 (+0.3%). Indeed, prices of houses remained on the rise (+0.8% between Q2 2015 and Q2 2016) while the decline in the prices of flats eased off (−0.3%, after −0.9% during Q1).
graphiqueGraphique1a – Prices of second-hand dwellings in metropolitan France

- Sources: INSEE, French notaries - Database Bien, Perval society
graphiqueGraphique2a – Prices of second-hand dwellings in Île-de-France
- Scope: Île-de-France
- Sources: INSEE, French notaries - Database Bien, Perval society
tableauTableau1a – Variation in prices of second-hand dwellings in metropolitan France
| change in | ||||||
|---|---|---|---|---|---|---|
| 3 months (S.A.) | 12 months | |||||
| 2015 Q4 | 2016 Q1 (sd) | 2016 Q2 (p) | 2015 Q4 | 2016 Q1 (sd) | 2016 Q2 (p) | |
| France | 0.2 | 0.4 | 0.0 | -0.4 | 0.3 | 0.7 |
| Flats | 0.0 | 0.1 | 0.5 | -1.1 | -0.4 | 0.6 |
| Houses | 0.3 | 0.7 | -0.3 | 0.1 | 0.9 | 0.9 |
- (p): provisional; (sd): semi-definitive
- Scope: Metropolitan France
- Sources: INSEE, French notaries - Database Bien, Perval society
The annual volume of transactions recovered its level at the beginning of 2012
The annual transaction volume continued to grow in Q2 2016, confirming the resumption started at the beginning of 2015: in June, the number of transactions carried out over the last twelve months was estimated at 830,000, against 815,000 in March. This volume of transactions was significantly higher than the one recorded one year before (717,000 in June 2015, that is +16%), and even recovered the high levels of early 2012.
graphiqueGraphique3a – Volume of transactions of second-hand dwellings over the last 12 months

- Scope: Metropolitan France
- Sources: CGEDD, based on notarial databases and DGFiP (MEDOC)
Revisions
The second-hand housing price index is revised to include transactions recorded after the previous publication. Furthermore, for the publication of Q2 2016, the seasonal adjustment parameters have been revised. This could marginally change the figures from the beginning of 2008.
In comparison with the results released on 4 July 2016, the change in prices in Q1 2016 has been revised downwards by −0.1 points overall, namely −0.2 points for houses and +0.1 points for flats. The overall change in prices in Q1 2016 stands at +0.4%, instead of +0.5% (figure estimated on 4 July) and +0.7% estimated on 26 May.
tableauTableau2a – Variation in prices of second-hand dwellings in metropolitan France
| Change in | ||||||
|---|---|---|---|---|---|---|
| 3 months (S.A.) | 12 months | |||||
| 2015 Q4 | 2016 Q1 (sd) | 2016 Q2 (p) | 2015 Q4 | 2016 Q1 (sd) | 2016 Q2 (p) | |
| Metropolitan France | 0.2 | 0.4 | 0.0 | -0.4 | 0.3 | 0.7 |
| - Flats | 0.0 | 0.1 | 0.5 | -1.1 | -0.4 | 0.6 |
| - Houses | 0.3 | 0.7 | -0.3 | 0.1 | 0.9 | 0.9 |
| Île-de-France | -0.1 | 0.5 | 0.8 | -0.9 | 0.2 | 1.4 |
| Provincial France | 0.3 | 0.4 | -0.3 | -0.2 | 0.3 | 0.5 |
| Flats | ||||||
| Île-de-France | 0.0 | 0.4 | 1.0 | -1.1 | 0.1 | 1.5 |
| - Paris | 0.7 | 0.2 | 1.2 | 0.4 | 1.3 | 2.6 |
| - Seine-et-Marne | -0.2 | -1.1 | 0.1 | -1.8 | -1.9 | -1.6 |
| - Yvelines | -1.2 | 0.9 | 0.8 | -4.0 | -1.0 | 0.5 |
| - Essonne | 0.1 | -0.6 | 0.1 | -1.4 | -1.2 | -0.7 |
| - Hauts-de-Seine | -0.9 | 1.1 | 1.3 | -2.6 | -0.6 | 1.2 |
| - Seine-Saint-Denis | -0.5 | 0.3 | 0.8 | -2.0 | -1.0 | 0.3 |
| - Val-de-Marne | -0.4 | 0.2 | 1.2 | -1.7 | -0.8 | 0.9 |
| - Val-d'Oise | -0.1 | -0.1 | 0.3 | -2.0 | -1.4 | -0.5 |
| Provincial France | 0.1 | -0.2 | 0.0 | -1.1 | -0.9 | -0.3 |
| - Conurbation > 10 000 inhabitants | 0.1 | 0.0 | ** | -1.1 | -0.8 | ** |
| - Central town | 0.1 | 0.0 | ** | -1.1 | -0.9 | ** |
| - Suburb | 0.1 | -0.1 | ** | -1.1 | -0.6 | ** |
| - Conurbation < 10 000 inhabitants | -0.5 | -1.0 | ** | -1.0 | -1.7 | ** |
| Houses | ||||||
| Île-de-France | -0.2 | 0.7 | 0.4 | -0.5 | 0.5 | 1.2 |
| - Seine-et-Marne | 0.1 | 0.2 | 0.3 | -0.1 | 0.1 | 0.6 |
| - Yvelines | -0.6 | 0.9 | 0.0 | -0.8 | 0.4 | 0.6 |
| - Essonne | -0.2 | 0.3 | 0.7 | -0.2 | -0.1 | 1.0 |
| - Hauts-de-Seine | -2.0 | 3.5 | -0.6 | -2.7 | 2.5 | 1.7 |
| - Seine-Saint-Denis | 0.9 | -0.8 | 1.0 | 1.1 | -0.3 | 2.2 |
| - Val-de-Marne | -0.1 | 0.8 | 0.7 | -0.6 | 0.6 | 1.9 |
| - Val-d'Oise | 0.5 | -0.2 | 0.8 | 0.2 | 0.2 | 1.2 |
| Provincial France | 0.4 | 0.7 | -0.4 | 0.2 | 0.9 | 0.8 |
| Nord-Pas de Calais | -0.1 | * | ** | 0.6 | * | ** |
| - Flats | -0.7 | * | ** | -2.0 | * | ** |
| - Houses | 0.1 | * | ** | 1.1 | * | ** |
| - Lille Houses | -0.6 | * | ** | 2.2 | * | ** |
| Provence-Alpes-Côte d'Azur | 0.3 | 0.9 | ** | -0.9 | 1.1 | ** |
| - Flats | -0.3 | -0.3 | ** | -1.6 | -1.0 | ** |
| - Houses | 0.9 | 2.2 | ** | -0.2 | 3.2 | ** |
| - Marseille Flats | 0.1 | -3.7 | ** | -2.6 | -3.1 | ** |
| Rhône-Alpes | 1.0 | * | ** | 0.4 | * | ** |
| - Flats | 0.8 | * | ** | 0.0 | * | ** |
| - Houses | 1.1 | * | ** | 0.9 | * | ** |
| - Lyon Flats | 0.0 | * | ** | 1.0 | * | ** |
- ** index released on 3 October 2016
- * data for Q1 2016 about Nord-Pas-de-Calais and Rhône-Alpes could not be released here, because of an insufficient average rate in accordance with the criteria set out by the Scientific Board of the Notaires-INSEE indexes.
- (p): provisional; (sd): semi-definitive
- Sources: INSEE, French notaries - Database Bien, Perval society
Pour en savoir plus
