


 30 September 2016
2016- n° 255At the end of Q2 2016, the Maastricht debt accounted for 98.4% of GDP Debt of the general government according to the Maastricht definition - 2nd Quarter
2016
30 September 2016
2016- n° 255At the end of Q2 2016, the Maastricht debt accounted for 98.4% of GDP Debt of the general government according to the Maastricht definition - 2nd Quarter
2016
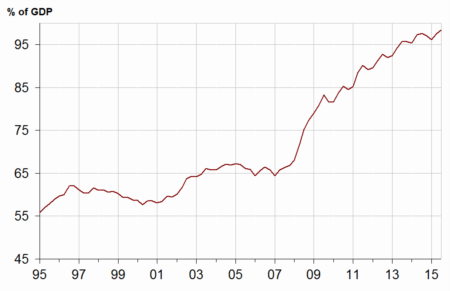
At the end of Q2 2016, the Maastricht debt amounted to €2,170.6 billion, a €31.7 billion increase in comparison to Q1 2016. It accounted for 98.4% of GDP, 0.9 points higher than the Q1 2016's level. The net public debt increased more moderately (€ +24.9 billion).
- The Maastricht debt increased by €31.7 billion compared to the previous quarter
- State, social security funds and local government debts went up
- Central agencies debt decreased
- In Q2 2016, the net public debt increased by €24.9 billion
- The overall value of quoted shares and mutual fund shares held by general government decreased

Erratum: this Informations rapides replaces and supersedes the issue published on 30 September 2016 at 8:45 am, the column "2015 Q4" being rectified in the table on the general government debt under the Maastricht treaty and in the table on the general government net debt.
Warnings: Quarterly debt figures are based on an accounting data source less exhaustive than the annual accounts. Results may therefore be updated during several quarters.
Quarterly debt variations alone are not sufficient to forecast the deficit for the current quarter. To obtain the deficit from the change in the Maastricht gross public debt, net acquisitions of financial assets and other accounts receivable and payable must also be taken into consideration, as well as the fact that the Maastricht debt is in nominal value. Moreover, the quarterly deficit published by INSEE is seasonally and trading-day adjusted, which is not the case of the quarterly debt.
The Maastricht debt increased by €31.7 billion compared to the previous quarter
At the end of Q2 2016, the Maastricht debt amounted to €2,170.6 billion, a €31.7 billion increase in comparison to Q1 2016. It accounted for 98.4% of GDP, 0.9 points higher than the Q1 2016's level. The net public debt increased more moderately (€ +24.9 billion).
State, social security funds and local government debts went up
In the second quarter of 2016, the State contribution to the debt increased by €29.8 billion. This rise stemmed mainly from long-term negotiable debt (€ +30.7 billion). Furthermore, deposits at the French Treasury increased (€ +0.6 billion) as well as outstanding loans increased (€ +0.1 billion). On the other hand, short-term negotiable debt went down (€ −1.7 billion).
Social security funds contribution to the debt went up (€ +2.3 billion), above all because of CADES (€ +2.7 billion) which borrowed from units outside general government and, to a lesser extent, ACOSS (€ +0.8 billion), MSA (€ +0.2 billion) and Pôle Emploi (€ +0.2 billion). Conversely, UNEDIC reduced its debt by €0.8 billion and CNAF by €0.7 billion.
The contribution of local government grew slightly (€ +0.4 billion). Regions borrowed €1.2 billion whereas municipalities repaid €0.4 billion and departments €0.3 billion. The contribution of other local government units (intercommunal syndicates and local agencies) was stable.
Central agencies debt decreased
Central agencies' contribution diminished slightly (€ −0.8 billion) as the Caisse nationale des autoroutes (CNA) and the Banque publique d'investissement respectively paid back €0.5 billion and €0.4 billion of long-term loans.
graphiqueGraphIR – General government debt under the Maastricht treaty (% of GDP) (*)
tableauTableauA – General government debt under the Maastricht treaty by sub-sector and by category
| 2015Q2 | 2015Q3 | 2015Q4 | 2016Q1 | 2016Q2 | |
|---|---|---|---|---|---|
| General Government | 2,107.9 | 2,105.7 | 2,097.4 | 2,138.9 | 2,170.6 |
| %of GDP | 97.6% | 97.1% | 96.2% | 97.5% | 98.4% |
| of which, by sub-sector : | |||||
| State | 1,673.9 | 1,672.7 | 1,661.7 | 1,695.1 | 1,724.8 |
| Central agencies | 22.1 | 22.1 | 18.9 | 18.8 | 18.0 |
| Local government | 187.5 | 185.9 | 196.5 | 194.1 | 194.5 |
| Social security funds | 224.4 | 225.0 | 220.3 | 230.9 | 233.3 |
| of which, by category | |||||
| Currency and deposits | 41.0 | 41.7 | 39.2 | 36.8 | 37.4 |
| Securities other than shares | 1,778.1 | 1,774.8 | 1,760.9 | 1,812.8 | 1,844.2 |
| short-term | 191.7 | 189.7 | 177.4 | 187.5 | 193.8 |
| long-term | 1,586.4 | 1,585.1 | 1,583.5 | 1,625.2 | 1,650.4 |
| Loans | 288.8 | 289.3 | 297.3 | 289.4 | 289.1 |
| short-term | 15.2 | 14.0 | 14.6 | 13.9 | 15.1 |
| long-term | 273.6 | 275.2 | 282.8 | 275.4 | 273.9 |
- (*) Explanations in the box "For more details"
- Source : National Accounts 2010 basis - Insee, DGFiP, Banque de France
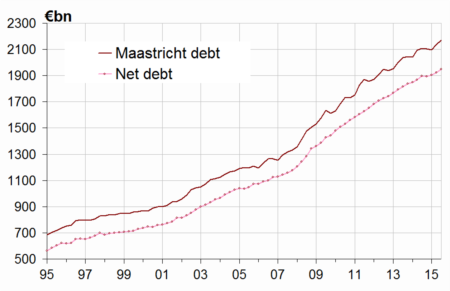
In Q2 2016, the net public debt increased by €24.9 billion
At the end of Q2 2016, the net public debt reached €1,948.1 billion (equivalent to 88.3% of GDP versus to 87.7% in Q1 2016), a €24.9 billion rise compared to the previous quarter. The € −6.8 billion gap between changes in net and gross debt is mainly explained by a sharp increase in the State's cash position (€ +9.6 billion). However, the cash position of social security funds decreased (€ −2.2 billion). Central agencies eased € 1.2 billion to repay loans. Social Security Funds lent €1.3 billion to borrowers outside general government. The State was reimbursed €0.3 billion of long-term loans.
tableauTableauB – General government net debt by sub-sector
| 2015Q2 | 2015Q3 | 2015Q4 | 2016Q1 | 2016Q2 | |
|---|---|---|---|---|---|
| General government | 1,895.9 | 1,894.5 | 1,905.0 | 1,923.2 | 1,948.1 |
| of which : | |||||
| The State | 1,551.8 | 1,553.8 | 1,556.8 | 1,572.6 | 1,593.1 |
| Central agencies | 5.8 | 5.6 | 3.0 | 2.8 | 3.7 |
| Local government | 175.1 | 173.6 | 184.0 | 181.3 | 181.8 |
| Social security funds | 163.2 | 161.6 | 161.2 | 166.4 | 169.6 |
graphiqueGraph_dette_nette – Maastricht gross debt and net debt
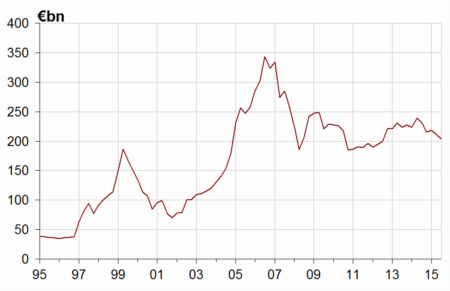
The overall value of quoted shares and mutual fund shares held by general government decreased
In Q2 2016, the overall value of quoted shares and mutual fund shares held by general government units went down to €203.9 billion, a €7.3 billion decrease compared to Q1 2016. The quoted shares held by the State lost €4.6 billion of value, mostly because of the fall in Renault's and Orange's share prices. Concurrently, social security funds' shares lost €0.5 billion of value.
The value of mutual fund shares held went down by €2.2 billion, mainly due to UNEDIC (€ −2.1 billion). Conversely, the Fonds de réserve pour les retraites (FRR) bought €0.5 billion of mutual fund shares and the Régime social des indépendants (RSI) €0.4 billion. Finally, the value of various mutual fund shares held by the general government diminished by €1.0 billion.
tableauTableauC – General government holdings of quoted shares and mutual fund shares
| 2015Q2 | 2015Q3 | 2015Q4 | 2016Q1 | 2016Q2 | |
|---|---|---|---|---|---|
| General government | 230.4 | 215.2 | 218.1 | 211.2 | 203.9 |
| of which : | |||||
| The State | 72.2 | 64.1 | 62.9 | 57.6 | 53.0 |
| Central agencies | 33.9 | 31.2 | 31.6 | 30.3 | 30.3 |
| Local government | 0.2 | 0.2 | 0.2 | 0.2 | 0.2 |
| Social security funds | 124.1 | 119.7 | 123.4 | 123.1 | 120.4 |
graphiqueGraph_F5 – General government holdings of quoted shares and mutual fund shares
Pour en savoir plus
