


 31 August 2016
2016- n° 226In July, household consumption expenditure on goods edged down (−0.2%) Household consumption expenditure on goods - July 2016
31 August 2016
2016- n° 226In July, household consumption expenditure on goods edged down (−0.2%) Household consumption expenditure on goods - July 2016
In July 2016, household consumption expenditure on goods decreased slightly (-0.2% in volume*), after a sharper decline in June (-0.8%); it is the fourth consecutive month of decline. In particular, purchases of cars and durables fell strongly. Conversely, expenses on fuel were on the rise.
In July 2016, household consumption expenditure on goods decreased slightly (−0.2% in volume*), after a sharper decline in June (−0.8%); it is the fourth consecutive month of decline. In particular, purchases of cars and durables fell strongly. Conversely, expenses on fuel were on the rise.
Engineered goods: declining anew
In July, purchases of engineered goods declined anew (−1.2%) after a slight rebound in June (+0.4%).
graphiquegraph1_new_ang – Total consumption of goods
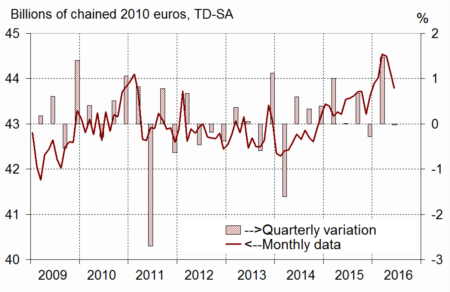
- Source: INSEE
Durables: strong decline
In July, expenses on durables decreased clearly (−2.2%) after a moderate growth in June (+0.6%). The decline was particularly pronounced for household durables (−3.1%), notably for televisions. Car purchases decreased for the fourth consecutive month: −1.9% in July.
Textile-clothing: downturn
In July, global expenses on textile-clothing shrank (−1.2% after +0.8%), despite a rise in shoes purchases.
Other engineered goods: recovering slightly
In July, household expenditure on other engineered goods climbed anew slightly (+0.5% after −0.2% in June), notably because of perfume purchases.

* Volumes are measured at chain-link previous year prices (2010 euro billions) and all figures are trading days and seasonally adjusted.
graphiquegraph4_new_ang – Breakdown of engineered goods
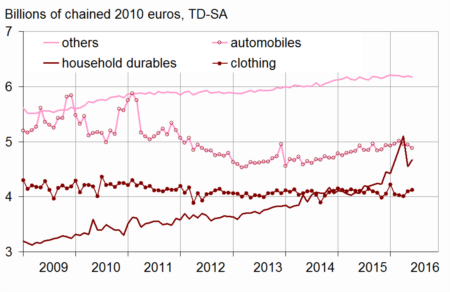
- Source: INSEE
Energy: rebound
In July, consumption of energy bounced back (+1.3%), after a strong decline in June (−6.4%). Indeed, consumption of refined products picked up (+6.5%) after plummeting in June (−14.3%), bolstered mainly by fuel expenses. However, expenses on gas and electricity slipped back slightly after being stable in June.
Food products: growing again
Consumption of food products went up again slightly in July (+0.3% after +0.5% in June and +0.4% in May). Expenses on agricultural products decreased clearly, but were compensated by the rebound in tobacco and meat consumption.
graphiquegraph3_new_ang – Energy
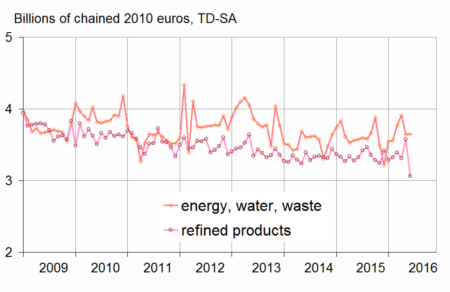
- Source: INSEE
graphiquegraph2_new_ang – Food and engineered goods
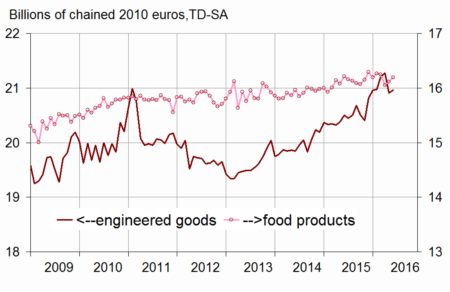
- Source: INSEE
The variation in June 2016 is unchanged
The variation of household expenditure on goods in June is inchanged.
tableautab1_eng – Household consumption expenditure on goods
| Weight (1) | May 2016 | June 2016 | July 2016 | July 16 / July 15 | Q/Q-1 (2) | |
|---|---|---|---|---|---|---|
| Food products | 38 | 0,4 | 0,5 | 0,3 | 0,5 | 0,0 |
| Engineered goods | 45 | –1,7 | 0,4 | –1,2 | 1,5 | –1,2 |
| - Inc. Durables | 22 | –4,2 | 0,6 | –2,2 | 2,3 | –3,1 |
| - Automobiles | 12 | –0,2 | –1,4 | –1,9 | –1,4 | –2,2 |
| - Household durables | 7 | −10,9 | 3,6 | –3,1 | 9,0 | –5,3 |
| - Inc. Textile-clothing | 9 | 1,9 | 0,8 | –1,2 | –0,3 | 1,6 |
| - Inc. Other engineered goods | 13 | 0,4 | –0,2 | 0,5 | 1,3 | 0,2 |
| Energy | 17 | –0,5 | –6,4 | 1,3 | –2,1 | –2,3 |
| - Inc. Energy, water, waste | 10 | –6,9 | 0,1 | –2,4 | –1,1 | –3,5 |
| - Inc. Refined Products | 8 | 8,5 | −14,3 | 6,5 | –3,2 | –0,6 |
| Total | 100 | –0,7 | –0,8 | –0,2 | 0,5 | –1,0 |
| - Inc. Manufactured goods | 84 | 0,2 | –1,2 | 0,2 | 1,0 | –0,6 |
- (1) Weighting in the consumption expenditure on goods in value
- (2) Last three months / previous three months
- Source: INSEE
Documentation
Methodology (pdf,23 Ko)
Pour en savoir plus
