


 22 September 2016
2016- n° 250In September 2016, the French business climate improves slightly Business climate indicator and turning point indicator - September 2016
22 September 2016
2016- n° 250In September 2016, the French business climate improves slightly Business climate indicator and turning point indicator - September 2016
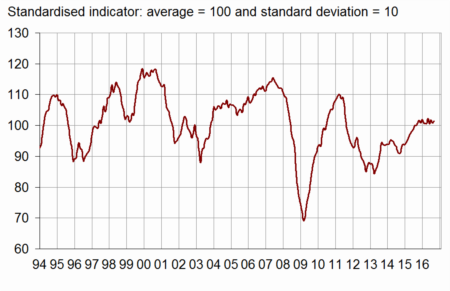
In September 2016, the business climate indicator has improved slightly. The composite indicator, compiled from the answers of business managers in the main sectors, has gained one point and has returned to its level of July. At 102, it stands slightly above its long-term average (100). The climate has gained two points in manufacturing and one point in services. However, it has lost five points in wholesale trade and one point in retail trade. It is stable in building construction.
The French business climate has gained one point
In September 2016, the business climate indicator has improved slightly. The composite indicator, compiled from the answers of business managers in the main sectors, has gained one point and has returned to its level of July. At 102, it stands slightly above its long-term average (100). The climate has gained two points in manufacturing and one point in services. However, it has lost five points in wholesale trade and one point in retail trade. It is stable in building construction.
graphiqueGraph_indicret – Turning point indicator
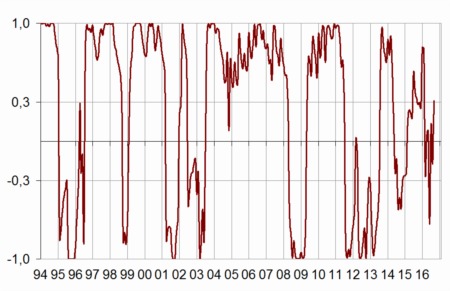
- Close to +1 (resp. −1) : favourable business climate (unfavourable). Between −0.3 and +0.3: uncertainty area
The turning point indicator for the French economy as a whole remains in the area showing an uncertain short-term economic outlook.
graphiqueGraph_climaff – French business climate composite indicator
tableauTableau – Business climate and turning point indicators
| May 16 | June 16 | July 16 | Aug. 16 | Sept. 16 | |
|---|---|---|---|---|---|
| Composite indicators | |||||
| France | 102 | 100 | 102 | 101 | 102 |
| Manufacturing | 104 | 102 | 103 | 101 | 103 |
| Wholesale trade | 102 | - | 104 | - | 99 |
| Building construction | 95 | 95 | 95 | 95 | 95 |
| Retail trade | 103 | 102 | 104 | 103 | 102 |
| Services | 101 | 98 | 101 | 101 | 102 |
| Turning point indicators | |||||
| France | 0,1 | –0,7 | 0,1 | –0,2 | 0,3 |
| Manufacturing | 0,0 | –0,4 | 0,0 | –0,1 | 0,2 |
| Wholesale trade | 0,5 | - | 0,5 | - | –0,5 |
| Building construction | 0,9 | –0,1 | 0,7 | –0,4 | –0,3 |
| Services | 0,8 | –0,5 | 0,2 | –0,4 | 0,2 |
- Source: INSEE, Business tendency surveys
Documentation
Methodology (pdf,125 Ko)
Pour en savoir plus
