


 11 August 2016
2016- n° 207In July 2016, consumer prices decreased by 0.4% over a month; they rose by 0.2% year-on-year Consumer price index - final results - July 2016
11 August 2016
2016- n° 207In July 2016, consumer prices decreased by 0.4% over a month; they rose by 0.2% year-on-year Consumer price index - final results - July 2016
In July 2016, the Consumer Prices Index (CPI) declined by 0.4% over a month, after an increase by 0.1% in June. Seasonally adjusted, it was stable in July after an upturn by 0.1% in June. Year-on-year, the CPI rose by 0.2%, as in the previous month.
Monthly change: −0.4%; Year-on-year: +0.2%
In July 2016, the Consumer Prices Index (CPI) declined by 0.4% over a month, after an increase by 0.1% in June. Seasonally adjusted, it was stable in July after an upturn by 0.1% in June. Year-on-year, the CPI rose by 0.2%, as in the previous month.
This month-on-month drop was mainly due to summer sales, underlying the seasonal fall in prices of manufactured products. Besides, energy prices fell back because of petroleum products. Conversely, prices of some services related to tourism expanded seasonally. Finally, food prices were very slightly up.
Seasonal fall in manufactured products
Manufactured products prices dropped seasonally in July (−2.9% against −3.1% in July 2015; −0.3% year-on-year) due to summer sales involving especially clothing and footwear (−14.2% against −14.4% in July 2015; + 0.7% year-on-year). To a lesser extent, prices of other types of products diminished with summer sales, such as travel goods (−5.3%; +1.8% year-on-year), furniture and furnishings (−4.3%; +0.1% year-on-year), audio-visual, photographic and information processing equipment (−1.2%; −2.9% year-on-year), textile household articles (−1.8%; +1.9% year-on-year) and household appliances (−1.4%; −1.0% year-on-year). In addition, prices of new motor cars weakened owing to some discounts (−0.3%; −1.9% year-on-year). Lastly, prices of health products slipped again (−0.2%; −2.7% year-on-year).
tableauT1IR_Eng – Detailed figures for various groups
| Items | Weight | Index | Percentage change | |
|---|---|---|---|---|
| 2016 | July 016 | m-on-m change | y-on-y change | |
| a) All households | ||||
| Overall | 10000 | 100.25 | −0.4 | 0.2 |
| Overall SA* | 10000 | 100.32 | 0.0 | 0.2 |
| Food | 1615 | 100.87 | 0.1 | 1.2 |
| Fresh food | 217 | 105.89 | 0.6 | 8.5 |
| Other food | 1398 | 100.08 | 0.0 | 0.1 |
| Tobacco | 195 | 100.13 | 0.0 | 0.1 |
| Manufactured products | 2651 | 97.33 | −2.9 | −0.3 |
| Clothing and footwear | 414 | 88.79 | −14.2 | 0.7 |
| Medical products | 466 | 96.76 | −0.2 | −2.7 |
| Other manufactured products | 1771 | 99.25 | −1.0 | −0.2 |
| Energy | 773 | 98.07 | −1.3 | −3.3 |
| Petroleum products | 419 | 96.83 | −2.4 | −6.6 |
| Services | 4766 | 102.04 | 1.0 | 0.8 |
| Actual rentals and services for dwellings | 768 | 100.59 | 0.0 | 0.9 |
| Medical services | 598 | 100.55 | 0.2 | 0.6 |
| Transport | 279 | 104.97 | 7.3 | −2.1 |
| Communication | 245 | 102.54 | −0.1 | 1.9 |
| Other services | 2876 | 102.42 | 0.9 | 1.0 |
| Total except rents and tobacco | 9183 | 100.25 | −0.4 | 0.2 |
| Total except tobacco | 9805 | 100.26 | −0.4 | 0.2 |
| b) Urban working-class households or households of employees | ||||
| All products excluding tobacco | 9704 | 100.03 | −0.6 | 0.0 |
| c) Households that belong to the lowest equivalized disposable income quintile - France | ||||
| All products excluding tobacco | 9696 | 99.93 | −0.5 | −0.2 |
- *: seasonally adjusted
- Geographical coverage: France excluding Mayotte
- Source: INSEE - Consumer Price Indices
Downturn in energy prices
After four consecutive months of increases, energy prices were fell back anew in July 2016 (−1.3%; −3.3% year-on-year), driven by the reversal in petroleum product prices (−2.4%; −6.6% year-on-year). On the contrary, city gas prices, indexed with delay to the changes in oil prices, rose in July (+0.3%; −9.4% year-on-year). Electricity rates were stable over the month (+4.1% year-on-year).
Hike in service prices
Every year in July, services prices grew during the summer holidays (+1.0% over this month, +0.8% year-on-year). Thus, prices of accommodation services increased by 10.3 % over the month, but diminished year-on-year (−0.2%). Likewise, prices of package holidays leapt seasonally in July 2016 (14.4%; +2.1% year-on-year) as well as airfares (21.7%; −2.7% year-on-year). Moreover, prices of communication services were virtually stable in July (−0.1%; +1.9% year-on-year), but with contrasting variations depending on the type of services: Internet access prices declined whereas those of mobile phone services increased slightly .
Very slight rise in food prices
In July 2016, food prices were very slightly up (+0.1%; +1.2% year-on-year after +0.6%). Fresh foodstuffs became more expensive (+0.6% against −4.1% in July 2015), a portion of this difference (about 2 pourcentage points) arose from a new method of calculation implemented through the CPI change of base (see explanatory note). Excluding fresh products, food prices were unchanged for the eighth month in a row. Year-on-year, they were up by barely 0.1%, as in June.
Slowdown in core inflation
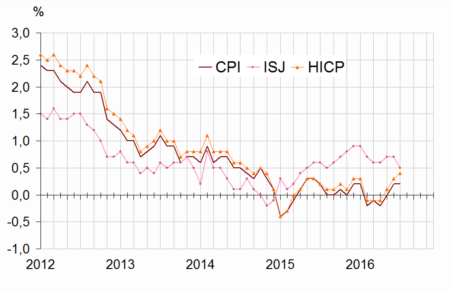
In July 2016, the core inflation indicator (ISJ) edged down by 0.1%. Year-on-year, it increased by 0.5%, at a slightly slower pace than in the two previous months (+0.7%). The Harmonised Index of Consumer Prices (HICP) dropped by 0.4% over one month, as the CPI; year-on-year, it rose by 0.4% (+0.3% in June).
graphiqueGraphiqueIR_English – Consumer price index (CPI), core inflation (ISJ)* and Harmonised Indices of Consumer Prices (HICP)**year-on-year changes
tableauT2IR_Eng – Detailed figures for Core inflation* and HICP**
| Items | Weight | Index | Percentage change | |
|---|---|---|---|---|
| 2016 | July 2016 | m-on-m change | y-on-y change | |
| Core inflation - All items | 6075 | 100.67 | −0.1 | 0.5 |
| Food excluding fresh products, meat, milk and exotic products | 735 | 100.01 | 0.0 | 0.0 |
| Manufactured products | 2136 | 99.96 | −0.1 | 0.1 |
| Services including actual rentals and services for dwellings | 3204 | 101.26 | −0.1 | 1.0 |
| HICP - All items | 100.39 | −0.4 | 0.4 | |
- * Core inflation indicator excludes public sector prices, the most volatile consumer prices and the tax measures. Seasonally adjusted, this index is calculated for all households in France excluding overseas departments and territories. (in French “indice d'inflation sous-jacent - ISJ”)
- **HICP: Harmonised Indices of Consumer Prices are inflation figures designed for international comparison between Member states of the European Union. This index is calculated for all households in France excluding Mayotte.
- Source: INSEE - Consumer Price Indices
Revisions
Compared to the provisional estimates published on 29 July, the monthly and annual rates of change in the CPI and HICP are unrevised.
Documentation
Methodology (pdf,141 Ko)
Pour en savoir plus
