


 29 July 2016
2016- n° 201In June, household consumption expenditure on goods decreased again (−0.8%), it was
stable over the second quarter (0.0% after +1.5%) Household consumption expenditure on goods - June 2016
29 July 2016
2016- n° 201In June, household consumption expenditure on goods decreased again (−0.8%), it was
stable over the second quarter (0.0% after +1.5%) Household consumption expenditure on goods - June 2016
In June 2016, household consumption expenditure on goods decreased: -0.8% in volume*, as in May. Consumption of food products, as well as expenses on textile-clothing and on durables, increased yet this rise does not offset the fall in energy consumption. Over the second quarter, household consumption of goods was stable (after 1.5%): expenses on food products declined whereas expenditure on gas and electricity remained brisk.
- Energy: fall in June but further growth over the quarter
- Engineered goods: slight rebound in June, marked slowdown over the quarter
- Textile-clothing: renewed growth in June
- Durables: moderate upturn in June, deceleration over the quarter
- Other engineered goods: slight downturn
- Food products: new rise in June
- The variation in May 2016 is revised downwards
In June 2016, household consumption expenditure on goods decreased: −0.8% in volume*, as in May. Consumption of food products, as well as expenses on textile-clothing and on durables, increased yet this rise does not offset the fall in energy consumption. Over the second quarter, household consumption of goods was stable (after 1.5%): expenses on food products declined whereas expenditure on gas and electricity remained brisk.
Energy: fall in June but further growth over the quarter
In June, consumption of energy tumbled significantly (−6.3% after −0.8%); it is its highest drop since June 2013. It comes from the sharp downturn in consumption of refined products (−14.3%) following the substantial rise in May (+8.0%), which was spurred by precautionary purchases during the social movements. However, expenditure on gas and electricity grew slightly after a marked decrease in May (+0.1% after −6.9%). Over the quarter, consumption of energy rose again markedly (+1.4% after +1.7%), in particular expenses on heating, which were driven by the relative coolness during the spring.
Engineered goods: slight rebound in June, marked slowdown over the quarter
In June, purchases of engineered goods picked up slightly (+0.3% after −1.7%) as a result of a moderate rebound in durables consumption and of the increase in expenses on textile-clothing. However, purchases of engineered goods decelerated significantly over the quarter (0.0% after +2.3%).
Textile-clothing: renewed growth in June
In June, expenses on textile-clothing continued to grow (+0.7% after +2.0%), notably with a marked rebound in expenses on textile and leather. They fall back over the second quarter (−0.6% after +1.6%).

* Volumes are chained and all figures are trading days and seasonally adjusted.
graphiquegraph1_new_ang – Total consumption of goods
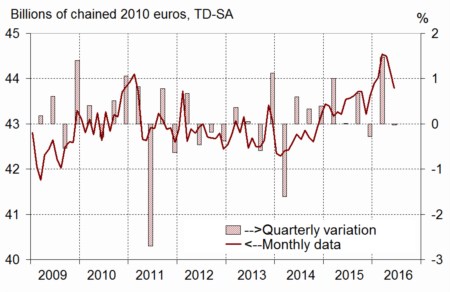
- Source: INSEE
graphiquegraph3_new_ang – Energy
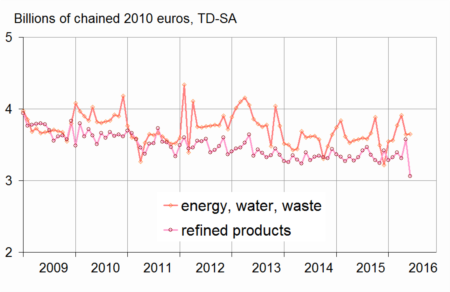
- Source: INSEE
graphiquegraph2_new_ang – Food and engineered goods
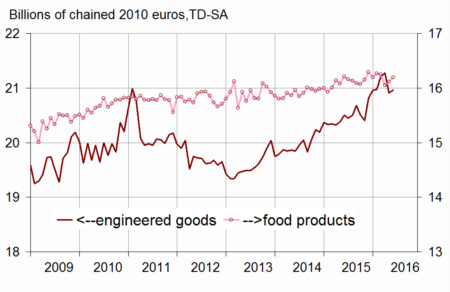
- Source: INSEE
Durables: moderate upturn in June, deceleration over the quarter
In June, consumption of durables bounced back moderately (+0.4% after −4.2%). Expenditure on household durables started climbing anew after a substantial downturn in May (+2.8% after −10.9%), bolstered notably by furniture purchases. Conversely, car purchases dipped for the third consecutive month (−1.2%). Over the quarter, consumption of durables kept increasing but decelerated (+0.5% after +3.6%), dampened by expenses on household durables (+2.8% after +7.9%) and car purchases (−0.9% after +1.8%).
Other engineered goods: slight downturn
In June, household expenditure on other engineered goods fell back slightly (−0.3% after +0.2%), mainly owing to the decline in purchases of perfumes. Over the quarter, expenditure on other engineered goods fell back likewise (−0.4% after +0.6%).
Food products: new rise in June
Consumption of food products went up again in June (+0.5% after +0.4%). Expenditure on agricultural goods increased significantly, whereas tobacco consumption declined. Over the quarter, food consumption fell back (−0.7% after +0.4%).
The variation in May 2016 is revised downwards
The variation of household expenditure on goods in May 2016 has been revised downwards by 0.1 point: it now stands at −0.8%, instead of −0.7%. Since the previous publication, new information has been integrated, particularly concerning household durables, and the seasonal adjustment coefficients have been updated.
graphiquegraph4_new_ang – Breakdown of engineered goods
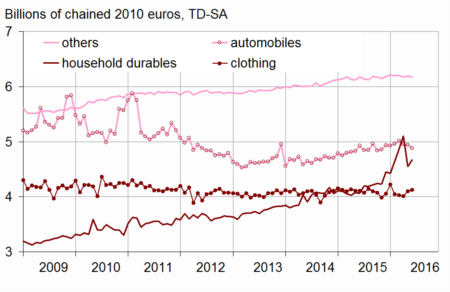
- Source: INSEE
tableautab1_eng – Household consumption expenditure on goods
| Weight (1) | Apr. 2016 | May 2016 | June 2016 | June 16 / June 15 | Q2 2016 /Q1 2016 | |
|---|---|---|---|---|---|---|
| Food products | 38 | –1.2 | 0.4 | 0.5 | –0.1 | –0.7 |
| Engineered goods | 45 | 0.4 | –1.7 | 0.3 | 2.3 | 0.0 |
| - Inc. Durables | 22 | 1.1 | –4.2 | 0.4 | 4.5 | 0.5 |
| - Automobiles | 12 | –1.3 | –0.2 | –1.2 | –0.9 | –0.9 |
| - Household durables | 7 | 4.8 | –10.9 | 2.8 | 14.9 | 2.8 |
| - Inc. Textile-clothing | 9 | –0.4 | 2.0 | 0.7 | 0.3 | –0.6 |
| - Inc. Other engineered goods | 13 | –0.4 | 0.2 | –0.3 | 0.0 | –0.4 |
| Energy | 17 | 1.1 | –0.8 | –6.3 | –2.3 | 1.4 |
| - Inc. Energy, water, waste | 10 | 3.8 | –6.9 | 0.1 | 2.0 | 2.9 |
| - Inc. Refined Products | 8 | –2.5 | 8.0 | –14.3 | –7.9 | –0.6 |
| Total | 100 | –0.1 | –0.8 | –0.8 | 0.6 | 0.0 |
| - Inc. Manufactured goods | 84 | –0.5 | 0.1 | –1.2 | 0.6 | –0.2 |
- (1) Weighting in the consumption expenditure on goods in value
Documentation
Methodology (pdf,23 Ko)
Pour en savoir plus
