


 30 June 2016
2016- n° 175In May 2016, overall producer prices of agricultural products were stable over one
year Indices of agricultural prices - May 2016
30 June 2016
2016- n° 175In May 2016, overall producer prices of agricultural products were stable over one
year Indices of agricultural prices - May 2016
In May 2016, overall producer prices of agricultural products were stable over one year. Excluding fruits and vegetables, they increased by 0.8% over one month and declined by 0.2% year on year.
In May 2016, overall producer prices of agricultural products were stable over one year. Excluding fruits and vegetables, they increased by 0.8% over one month and declined by 0.2% year on year.
Cereal and oleaginous prices continued to rally
Cereal prices kept on increasing in May (+2.5% after +2.0% in April). Wheat exports were dynamic noticeably towards Maghreb and Asia. The price of maïze recovered for two months mainly due to a global supply affected by adverse weather conditions in South America and exhausted availability in Ukraine. Compared to last year, the abundance of the world supply continued to weigh on cereal prices (−6.1% yoy). However this decline was much less marked than in April (−15,5%), as prices had been particularly low in May 2015.
graphiquecereal – Producer prices of cereals
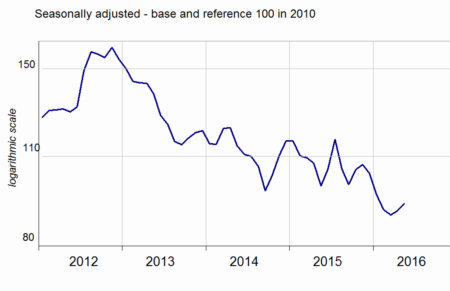
- Source: INSEE
Oleaginous prices continued to rally in May (+1.0% after +3.4%). Rape prices increased in the wake of oil price, while soy price jumped due to a stronger Chinese demand.
Over a year, surge in potato prices, moderate rise for vegetables and fresh fruits
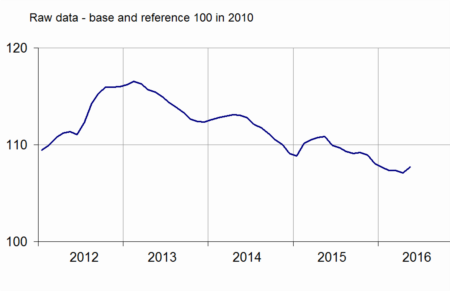
Potato prices nearly doubled (+83.8%) in May over one year. The 2015 crop, still put on sale, reached its long-term average whereas the previous one was exceptional. Over one year, fresh fruits prices increased (+3.9%). Stawberry price rose due to a limited supply, as cool weather slowed down the harvests and damaged the fruits. Fresh vegetable prices expanded as well (+3.0% yoy), noticeably the price of cauliflower that became more rare: huge quantities had already been harvested as the mild winter had accelerated the growth of this vegetable. Nevertheless, tomatoes prices declined as the cool temperatures deterred demand.
graphiquevegetable – Producer prices of fresh vegetables

- Source: SSP (ministry in charge of agriculture)
Near stability in animal prices
In May, animals prices were virtually stable over one month (−0.2%). The price of big cattle fell over one month (−1.9%) and over one year (−4.7%) due to sluggish demand. Conversely, pork prices bounced back sharply (+5.9%): strong Chinese demand partly absorbed Spanish supply and freed the other export outlets for French production.
graphiquepig – Producer prices of pigs and large cattle
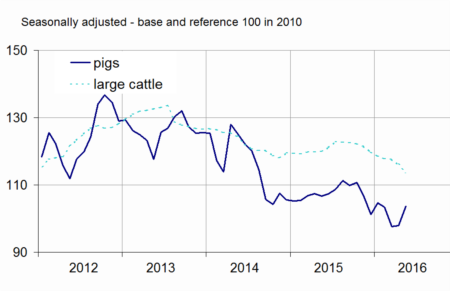
- Source: INSEE
Cow milk prices dropped over one year (−8.3%) and eggs prices sank over the last three months (−18.5%), due to over production.
tableauTab1 – Indices of producer prices of agricultural products (IPPAP)
| Variation as % over | |||||
|---|---|---|---|---|---|
| Weights | May 2016 | a month | 3 months | a year | |
| Agricultural goods output | 1000 | 110.5 | /// | /// | 0.0 |
| excluding fruits and vegetables | 900 | 111.4 | +0.8 | +1.2 | –0.2 |
| Crop output (excluding fruits and vegetables) | 505 | 115.9 | +1.8 | +2.5 | +3.3 |
| Cereals | 188 | 92.9 | +2.5 | +2.0 | –6.1 |
| of which soft wheat | 112 | 86.8 | +1.9 | +0.2 | –8.8 |
| grain maize | 41 | 96.6 | +5.5 | +10.3 | +8.9 |
| Potatoes | 26 | 209.2 | +8.1 | +15.7 | +83.8 |
| Wines | 177 | 133.8 | +0.5 | 0.0 | +2.5 |
| protected designation of origin | 84 | 141.9 | –0.4 | –0.6 | +4.7 |
| other wines | 23 | 151.0 | +4.9 | +2.4 | –0.2 |
| Oleaginous | 49 | 98.3 | +1.0 | +3.4 | –4.6 |
| Horticultural products | 30 | 111.7 | +1.2 | +5.3 | +4.4 |
| Other crop products | 36 | 107.7 | –0.1 | –0.5 | +1.1 |
| Fruits and vegetables (1) | 100 | 102.9 | /// | /// | +2.8 |
| Fresh vegetables | 53 | 100.5 | /// | /// | +3.0 |
| Fresh fruits | 35 | 101.8 | /// | /// | +3.9 |
| Animal output | 395 | 105.6 | –0.7 | –0.7 | –4.8 |
| Animals | 234 | 109.5 | –0.2 | –2.6 | –3.0 |
| of which large cattle | 96 | 113.8 | –1.9 | –3.3 | –4.7 |
| calves | 26 | 106.1 | –3.6 | –6.9 | +2.0 |
| pigs | 54 | 103.7 | +5.9 | +0.4 | –3.0 |
| sheep | 10 | 110.1 | –1.3 | –3.6 | –5.7 |
| poultry | 46 | 109.6 | –0.7 | –1.3 | –0.8 |
| of which chicken | 28 | 109.4 | –0.6 | –0.8 | –0.9 |
| Milk | 147 | 100.5 | /// | +4.8 | –7.7 |
| of which cow milk (2) | 137 | 99.8 | /// | +5.3 | –8.3 |
| Eggs | 15 | 93.1 | –14.4 | –18.5 | –9.6 |
- * Except for fresh fruits and vegetables
- (1) Including vegetables for industry.
- (2)The April value of cow milk price indice is carried forward in May
- Sources: INSEE, SSP (ministry in charge of agriculture)
Purchase prices of means of production slightly rose
In May, intermediate consumption prices increased (+0.4%), driven by energy prices which had recovered since February (+11.7% over three months). Capital goods prices grew by 0.4%, following the rise in prices of material for cultivation (+0.5%).
graphiquemeans – Purchase prices of the means of agricultural production
- Sources: INSEE, SSP (ministry in charge of agriculture)
tableauTab2 – Indices of purchase prices of the means of agricultural production (IPAMPA)
| Weights | May 2016 | variation as % over | |||
|---|---|---|---|---|---|
| a month | 3 months | a year | |||
| Total input | 1000 | 107.7 | +0.4 | +0.4 | –2.9 |
| Intermediate consumptions | 764 | 108.1 | +0.4 | +0.5 | –3.6 |
| Energy | 100 | 93.8 | +6.2 | +11.7 | –11.8 |
| Seeds | 57 | 106.9 | 0.0 | –0.7 | –1.7 |
| Fertilisers and soil improvers | 92 | 112.5 | –2.4 | –1.1 | –7.7 |
| Plant protection products | 78 | 99.8 | –0.2 | +0.4 | –1.1 |
| Animal feed | 205 | 111.4 | –0.3 | –2.2 | –5.7 |
| Veterinary expenses | 43 | 117.3 | +0.3 | +0.7 | +2.9 |
| Small equipment and tools | 17 | 107.1 | +0.6 | –0.6 | –0.4 |
| Maintenance of materials | 67 | 113.3 | +0.1 | –0.2 | +0.2 |
| Maintenance of buildings | 9 | 106.6 | +0.1 | +0.1 | –0.3 |
| Other goods and services | 97 | 105.4 | 0.0 | +0.1 | +4.3 |
| Goods and services contributing to investment | 236 | 106.9 | +0.4 | +0.1 | –0.3 |
| Material | 186 | 108.1 | +0.5 | 0.0 | +0.3 |
| Tractors | 79 | 108.1 | +0.7 | –0.2 | +0.3 |
| Machinery and equipment for cultivation | 36 | 110.7 | +0.8 | +0.4 | +1.4 |
| Machinery and equipment for harvesting | 42 | 108.4 | +0.2 | +0.2 | +0.6 |
| Utility vehicles | 18 | 104.1 | 0.0 | 0.0 | –1.0 |
| Buildings | 50 | 102.1 | 0.0 | +0.1 | –2.7 |
- (1) The repayment of the domestic tax on energy product (TICPE) benefiting farmers has been applied in advance for the year 2016
- Sources: INSEE, SSP (ministry in charge of agriculture)
Documentation
Methodology (pdf,122 Ko)
Pour en savoir plus
Time series : Indices of agricultural prices
