


 23 June 2016
2016- n° 163In June 2016, the business climate in services has gone down Monthly survey of services - June 2016
23 June 2016
2016- n° 163In June 2016, the business climate in services has gone down Monthly survey of services - June 2016
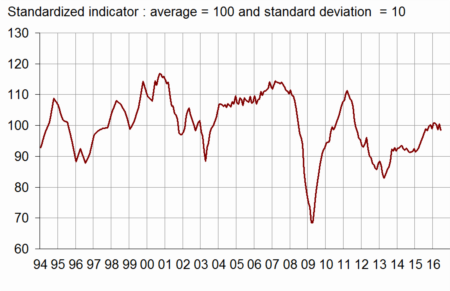
According to business leaders surveyed in June 2016, the business climate in services has weakened. The business climate composite indicator has decreased by three points (98) and has fallen back just below its long-term average (100).
- The business prospects have deteriorated
- The business climate has decreased in transport while remaining above its long-term average
- In accomodation and food service activities, the business climate has deviated further from its long-term average
- Stability of the business climate in information and communication
- Sharp decrease in the business climate in real estate activities
- In professional, scientific and technical activities, the business climate has returned slightly below its long-term average
- The business climate in administrative and support service activities has decreased but remains above its long-term average

Warnings :
1. From now on, new sub-sector business climate indicators are available.
2. The business climate composite indicator for all services is computed with a new method (cf. methodology).
3. For this publication, the seasonal coefficients have been updated and some non-adjusted data have been corrected, in order to stabilize the sectoral classification of the firms. As a result, the results previously published before have been negligibly modified at the most aggregated level but more significantly at a detailed sectoral level.
According to business leaders surveyed in June 2016, the business climate in services has weakened. The business climate composite indicator has decreased by three points (98) and has fallen back just below its long-term average (100).
graphiqueGraph1 – Business climate composite indicator
The turning point indicator has moved into the unfavourable area.
graphiquegraph_retourn – Turning point indicator
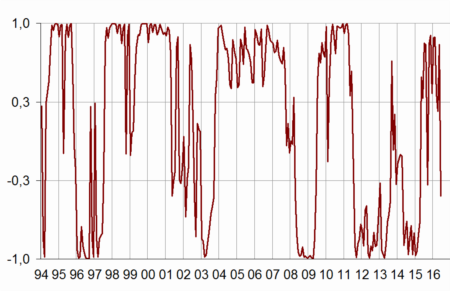
- Note: close to 1 (respectively -1), this indicator indicates a favourable short-term economic situation (respectively unfavourable). Between +0.3 and -0.3: uncertainty area.
The business prospects have deteriorated
The balances of opinion on past and expected activity have decreased and stand below their long-term average. More business leaders than last month anticipate a decrease in demand for the coming months; the corresponding balance is very close to its long-term average. However, the balance on the general outlook, which relates the assessment of business leaders over their whole sector, is virtually stable at its long-term average.
The balances on past and expected employment have gone down albeit remaining above their long-term average.
The balances on past and expected investments are practically unchanged, above their long-term average.
tableauTable_month – Economic outlook in the services sector
| Average* | March 16 | April 16 | May 16 | June 16 | |
|---|---|---|---|---|---|
| Composite indicator | 100 | 100 | 99 | 101 | 98 |
| General outlook | –8 | –8 | –8 | –7 | –8 |
| Past activity | 2 | 0 | 1 | 2 | –2 |
| Expected activity | 2 | 0 | –2 | –1 | –3 |
| Expected demand | –1 | 0 | –5 | 0 | –2 |
| Past selling prices | –4 | –9 | –13 | –9 | –10 |
| Expected selling prices | –3 | –4 | –4 | –7 | –7 |
| Past employment | 3 | 9 | 10 | 11 | 8 |
| except temporary work agencies | 1 | 4 | 2 | 5 | 2 |
| Expected employment | 2 | 6 | 6 | 7 | 4 |
| except temporary work agencies | –1 | –3 | –3 | –1 | –2 |
| Investments | |||||
| Past investments | 1 | 6 | 7 | 3 | 4 |
| Expected investments | 1 | 4 | 1 | 5 | 6 |
- * Average of the balances of opinion since 1988
- Source: INSEE
The weakening of the business climate for all services is a result of a decline in almost all the sub-sectors. The business climate has decreased by three points in transport, accomodation and food service activities and administrative and support service activities. Only the business climate in information and communication remains stable.
The business climate has decreased in transport while remaining above its long-term average
In road transport, the business climate has decreased by three points (102) but remains above its long-term average. The balances on past and expected activity and on expected demand have gone down markedly.
In accomodation and food service activities, the business climate has deviated further from its long-term average
In accomodation and food service activities, the business climate have fallen back by three points (94) and has deviated further from its long-term average. The balances on expected activity and demand stand clearly below their long-term average.
Stability of the business climate in information and communication
In information and communication, the business climate is stable (97), below its long-term average. The balances on activity and demand remain well below their long-term average. Nevertheless, the balances on employment are practically at their long-term average.
Sharp decrease in the business climate in real estate activities
In real estate activities, the business climate has dropped sharply. The indicator has decreased by five points (96), falling back below its long-term average.
In professional, scientific and technical activities, the business climate has returned slightly below its long-term average
The business climate in professional, scientific and technical activities has decreased by two points and has returned slightly below its long-term average. The improvement in the balances on past activity and employment is more than offset by the deterioration in the balances on expected activity, demand and employment.
The business climate in administrative and support service activities has decreased but remains above its long-term average
In administrative and support service activities, the business climate has lost three points (102) but remains above its long-term average. All the balances stay above their long-term average, particularly those on employment and past activity.
tableauTable_det – Business climate composite indicator and balances of opinion by sub-sector in services
| Aggregated classification (NA 2008) at level A21 | Mean* | March 16 | April 16 | May 16 | June 16 |
|---|---|---|---|---|---|
| Road transport (8%) | |||||
| Composite indicator | 100 | 105 | 103 | 105 | 102 |
| Past activity | –8 | –12 | –9 | –6 | –14 |
| Expected activity | –9 | 1 | –5 | –2 | –8 |
| Expected demand | –13 | –3 | –10 | –3 | –9 |
| Past employment | –8 | –5 | 3 | 0 | 3 |
| Expected employment | –10 | 1 | –2 | –6 | –7 |
| General outlook | –24 | –13 | –12 | –13 | –17 |
| Accomodation and food service activities (11%) | |||||
| Composite indicator | 100 | 92 | 89 | 97 | 94 |
| Past activity | –7 | –8 | –12 | –4 | –11 |
| Expected activity | –8 | –17 | –25 | –14 | –15 |
| Expected demand | –10 | –21 | –21 | –12 | –14 |
| Past employment | –4 | –8 | –4 | 5 | –1 |
| Expected employment | –6 | –7 | –11 | –3 | –3 |
| General outlook | –14 | –19 | –22 | –23 | –25 |
| Information and communication (24%) | |||||
| Composite indicator | 100 | 98 | 97 | 97 | 97 |
| Past activity | 8 | –3 | 7 | –7 | –5 |
| Expected activity | 10 | 1 | –4 | –7 | –6 |
| Expected demand | 10 | 11 | –2 | 5 | 4 |
| Past employment | 6 | 4 | 6 | 5 | 6 |
| Expected employment | 10 | 4 | 7 | 8 | 8 |
| General outlook | 0 | –2 | –6 | –3 | –1 |
| Real estate activities (13%) | |||||
| Composite indicator | 100 | 99 | 101 | 101 | 96 |
| Past activity | 7 | 1 | 1 | 6 | 4 |
| Expected activity | 7 | 12 | 15 | 12 | 11 |
| Expected demand | 1 | 3 | 4 | 2 | –2 |
| Past employment | 3 | 8 | 1 | 6 | 1 |
| Expected employment | 2 | –2 | 6 | 0 | –3 |
| General outlook | –2 | –3 | 0 | –1 | –3 |
| Professional, scientific and technical activities (24%) | |||||
| Composite indicator | 100 | 100 | 96 | 100 | 98 |
| Past activity | –1 | 1 | –7 | –3 | –1 |
| Expected activity | –2 | –4 | –5 | –3 | –7 |
| Expected demand | –6 | –6 | –11 | –4 | –5 |
| Past employment | 1 | 8 | 0 | –2 | 1 |
| Expected employment | 0 | 0 | –2 | 2 | –1 |
| General outlook | –9 | –8 | –10 | –8 | –8 |
| Administrative and support service activities (18%) | |||||
| Composite indicator | 100 | 103 | 103 | 105 | 102 |
| Past activity | 6 | 12 | 17 | 17 | 14 |
| Expected activity | 5 | 10 | 9 | 9 | 5 |
| Expected demand | 3 | 6 | 3 | 9 | 6 |
| Past employment | 9 | 22 | 31 | 30 | 21 |
| Expected employment | 7 | 21 | 22 | 18 | 12 |
| General outlook | –5 | –7 | –4 | –1 | –3 |
- The figures in parentheses indicate the weights used to aggregate the sub-sector balances of opinion.
- *Average of the balances of opinion since 1988 (2006 for road transport)
- Source: INSEE
Documentation
Methodology (2016) (pdf,158 Ko)
Pour en savoir plus
Time series : Economic outlook surveys – Services
