


 31 May 2016
2016- n° 147In March 2016, the sales volume returned to normal in household services and decreased
in retail trade Sales volume in the retail trade and personal services - March 2016
31 May 2016
2016- n° 147In March 2016, the sales volume returned to normal in household services and decreased
in retail trade Sales volume in the retail trade and personal services - March 2016
In March 2016, the sales volume fell back strongly in household services returning to a normal level after an exceptional surge in February linked to the opening of ticket sales for UEFA EURO 2016 (−10.0% after +12.2% in February). It edged down in retail trade, except of motor vehicles and motorcycles (−0.3% after +0.4%). On the contrary, it recovered in trade and repair of motor vehicles and motorcycles (+0.5% after −1.3%) and increased again in accommodation and food service activities (+0.5% after +1,5%).

Every index in this issue is in value (tax excluded), seasonally and working day adjusted (SA-WDA). The commentary shows variations of subsections by decreasing contribution. The contribution of a subsection depends on the extent of the change and on its weight.
In March 2016, the sales volume fell back strongly in household services returning to a normal level after an exceptional surge in February linked to the opening of ticket sales for UEFA EURO 2016 (−10.0% after +12.2% in February). It edged down in retail trade, except of motor vehicles and motorcycles (−0.3% after +0.4%). On the contrary, it recovered in trade and repair of motor vehicles and motorcycles (+0.5% after −1.3%) and increased again in accommodation and food service activities (+0.5% after +1,5%).
graphiqueGraph1_Anglais – Sales volume in the retail trade and personal services
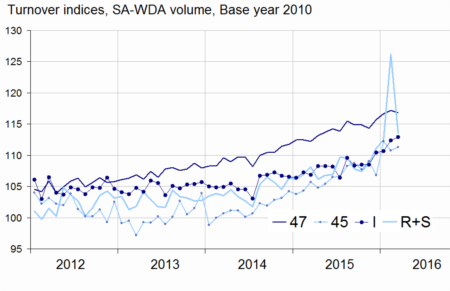
- Source: INSEE
Slight downturn in retail trade
In March 2016, the sales volume shrank slightly in retail trade, except of motor vehicles and motorcycles (−0.3% after +0.4% in February). According to early estimates, it should recover slightly in April (+0.2%).
The sales volume slipped back in all forms of retailing: non specialised stores (−0.4%), specialised stores (−0.2%), not in stores (−1.4%). Within specialised retailing, the fall in retail sale of automotive fuel (−2.6%) was largely offset by the increase in retail sale of other goods (clothings, perfumes, etc: +0.3%).
The sales volume in retail trade, except of motor vehicles and motorcycles increased over the first quarter(+1.7%) and year on year (+4.0%).
tableauTab1_anglais – Sales volume in the retail trade and personal services
| Change in % | |||||
|---|---|---|---|---|---|
| NACE Classification | Weight | Mar/ Feb. | Feb./ Jan. | q-o-q (1) | y-o-y (2) |
| 47 Retail trade, except of motor vehicles and motorcycles | 1000 | –0.3 | 0.4 | 1.7 | 4.0 |
| 471 Retail sale in non-specialized stores | 370 | –0.4 | 0.9 | 0.7 | 1.9 |
| 472 to 477 Retail sale in specialized stores | 572 | –0.2 | 0.1 | 2.2 | 5.2 |
| 478 and 479 Retail trade not in stores | 58 | –1.4 | 1.2 | 2.0 | 4.8 |
| 45 Trade and repair of motor vehicles and motorcycles | 1000 | 0.5 | –1.3 | 3.3 | 6.5 |
| I Accommodation and food service activities | 1000 | 0.5 | 1.5 | 2.6 | 4.8 |
| R+S Household services | 1000 | –10.0 | 12.2 | 7.6 | 9.7 |
| R Arts, entertainment and recreation | 422 | –22.0 | 27.5 | 15.3 | 18.3 |
| S Other service activities | 578 | 2.2 | –0.1 | 1.8 | 3.1 |
- (1) Quarter-on-quarter: last three months / previous three months.
- (2) Year-on-year: last three months / same three months of the previous year.
- The codes correspond to different levels of aggregation of the classification NAF rev.2
- Source: INSEE
tableauTabprecoce_anglais – Sales volume in the retail trade: early estimate*
| Change in % | ||
|---|---|---|
| Apr 2016/ Mar 2016 | Apr 2016/ Apr 2015 | |
| 47 Retail trade, except of motor vehicles and motorcycles | 0.2 | 3.4 |
- * Econometric estimate from a set of sources available within 30 days after the end of the reference month
- Source: INSEE
Rebound in trade and repair of motor vehicles and motorcycles
The sales volume in retail trade and repair of motor vehicles and motorcycles recovered in March (+0.5% after −1.3% in February), above all in sale of motor vehicles (+0.9% after −1.3%) and maintenance and repair of motor vehicles (+1.0% after −0.2%). On the contrary, the sales volume fell back significantly in sale, maintenance and repair of motorcycles and related parts and accessories (−6.5% after +9.0%).
The sales volume of the whole sector grew strongly over the first quarter (+3.3%) and year-on-year (+6.5%).
tableauTab2_anglais – Sales volume in the retail trade and personal services
| Change in % | |||||
|---|---|---|---|---|---|
| Nace Classification | Weight | Mar 2016 | Mar/ Feb. | Feb./Jan. | q-o-q (1) |
| 47 Retail trade, except of motor vehicles and motorcycles | 1000 | 116.8 | –0.3 | 0.4 | 1.7 |
| 471 Non-specialised stores | 370 | 109.8 | –0.4 | 0.9 | 0.7 |
| 472 to 477 Specialised stores | 572 | 121.0 | –0.2 | 0.1 | 2.2 |
| 472 Retail sale of food. beverages and tobacco in specialised stores | 48 | 131.6 | 0.3 | 1.4 | 3.3 |
| 473 Retail sale of automotive fuel | 77 | 98.1 | –2.6 | 1.2 | 2.2 |
| 474 Retail sale of information and communication equipment | 28 | 178.0 | 0.8 | –0.1 | 1.9 |
| 475 Retail sale of other household equipment | 113 | 106.1 | –0.1 | –0.3 | 3.5 |
| 476 Retail sale of cultural and recreation goods | 48 | 104.5 | –1.6 | –0.2 | 0.3 |
| 477 Retail sale of other goods in specialised stores | 259 | 129.3 | 0.3 | –0.3 | 2.0 |
| 478 et 479 Retail trade not in stores | 58 | 119.0 | –1.4 | 1.2 | 2.0 |
| 45 Wholesale and retail trade and repair of motor vehicles and motorcycles | 1000 | 111.3 | 0.5 | –1.3 | 3.3 |
| 451 Sale of motor vehicles | 671 | 107.5 | 0.9 | –1.3 | 3.9 |
| 452 Maintenance and repair of motor vehicles | 78 | 104.9 | 1.0 | –0.2 | 3.0 |
| 453 Sale of motor vehicle parts and accessories | 227 | 126.7 | –0.2 | –2.5 | 1.7 |
| 454 Sale. maintenance and repair of motorcycles and related parts and accessories | 24 | 91.6 | –6.5 | 9.0 | 6.2 |
| I Accommodation and food service activities | 1000 | 112.9 | 0.5 | 1.5 | 2.6 |
| 55 Accommodation | 239 | 107.5 | 1.5 | 2.0 | 2.9 |
| 56 Food and beverage service activities | 761 | 114.6 | 0.2 | 1.3 | 2.5 |
| 561 Restaurants… | 560 | 114.9 | 0.1 | 0.5 | 2.5 |
| 562 Event catering… | 119 | 108.2 | 0.0 | 5.7 | 1.9 |
| 563 Beverage serving activities | 82 | 121.8 | 0.6 | 1.2 | 3.6 |
| R+S Household services | 1000 | 113.6 | –10.0 | 12.2 | 7.6 |
| R Arts, entertainment and recreation | 422 | 118.0 | –22.0 | 27.5 | 15.3 |
| 90 Creative, arts and entertainment activities | 116 | 110.1 | –2.9 | 4.9 | 4.3 |
| 91 Libraries, archives. museums… | 10 | 137.1 | 6.9 | –0.3 | 2.5 |
| 92 Gambling and betting activities | 106 | 112.5 | –0.7 | 1.4 | 0.7 |
| 93 Sports activities and amusement... | 190 | 124.9 | –36.6 | 53.2 | 30.1 |
| S Other service activities | 578 | 110.3 | 2.2 | –0.1 | 1.8 |
| 95 Repair of computers… | 206 | 98.2 | 7.5 | –0.3 | 2.7 |
| 96 Other personal service activities | 372 | 117.1 | 0.0 | 0.1 | 1.4 |
- (1) Quarter-on-quarter: last three months / previous three months.
- Source: INSEE
Four-month-in-a-row increase in accommodation and food service activities
The sales volume in accommodation and food service activities has risen continuously since December 2015 (+0.5% in March after +1.2% on average over the three months before). The increase came mainly from accommodation sector (+1.5%), the sales volume being virtually stable in restaurants and fast food activities (+0.1%).
The sales volume of the whole sector increased sharply over the first quarter 2016 compared to the last quarter of 2015 (+2.6%) and compared to the first quarter of 2015 (+4.8%).
Fall in household services
In March. the sales volume in household services returned to normal after the February peak (−10.0% after +12.2% due to the starting of sales of UEFA EURO 2016 tickets). Compared to January, it increased by +1.0%. This shrinking sales volume concerned mainly sports activities and amusement (−36.6% after +53.2%) and more moderately creative, arts and entertainment activities (−2.9%). Conversely, sales volume picked up in repair of computers (+7.5% after −0.3%).
The sales volume in household services rose significantly over the first quarter (+7.6%) and year-on-year (+9.7%).
Revisions
The variation in the sales volume for February 2016 has been raised by 0.5 points in household services, from +11.7% to +12.2%, due to the new calculation of SA-WDA coefficients. The variation has been raised by 0.1 points in the other sectors.
In April, turnover in large-scale food retailing recovered
In April 2016, the turnover in large-scale food retailing recovered (+0.7% after −1.3% in March). Sales of food products (+1.8% after −1.9%) and sales of non-food products (+0.7% after –0.5%) bounced back. However, sales of automotive fuel decreased again (−0.7% after −0.3% in March).
tableauTab3_anglais – Monthly turnover indices in large-scale food retailing
| Change in % | ||||
|---|---|---|---|---|
| Mar 16/ Feb. 16 | Feb. 16/ Jan. 16 | q-o-q (1) | y-o-y (1) | |
| Turnover | 0.7 | –1.3 | 1.2 | 0.5 |
| Including | ||||
| Sales of food products | 1.8 | –1.9 | 0.8 | 2.3 |
| Sales of non-food products | 0.7 | –0.5 | 3.9 | –0.6 |
| Sales of automotive fuel | –0.7 | –0.3 | –0.3 | –9.1 |
- (1) Quarter-on-quarter: last three months / previous three months.
- Source: INSEE - Monthly survey on large scale food retailing (Emagsa)
Documentation
Methodology (pdf,121 Ko)
Pour en savoir plus
