


 30 June 2016
2016- n° 168At the end of Q1 2016, the Maastricht debt accounted for 97.5% of GDP Debt of the general government according to the Maastricht definition - 1st Quarter
2016
30 June 2016
2016- n° 168At the end of Q1 2016, the Maastricht debt accounted for 97.5% of GDP Debt of the general government according to the Maastricht definition - 1st Quarter
2016
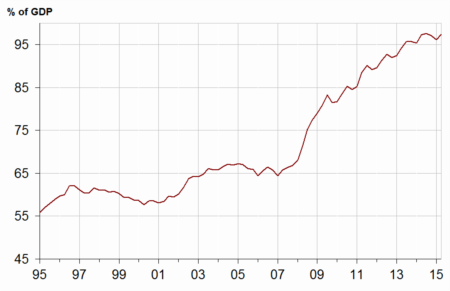
At the end of Q1 2016, the Maastricht debt amounted to €2,137.6 billion, a €40.7 billion increase in comparison to Q4 2015. It accounted for 97.5% of GDP, 1.4 points higher than the Q4 2015's level. The net public debt increased more slowly (€ +17.9 billion).
- The Maastricht debt increased by €40.7 billion compared to the previous quarter
- State and social security funds debts went up
- Local government and central agencies debts decreased
- In Q1 2016, the net public debt increased by €17.9 billion
- The overall value of quoted shares and mutual fund shares held by general government decreased

Erratum: this Informations rapides replaces and supersedes the issue published on 30 June 2016 at 8:45 am, the Maastricht debt to GDP ratio in Q1 2016 being rectified.
Warnings: Quarterly debt figures are based on an accounting data source less exhaustive than the annual accounts. Results may therefore be updated during several quarters.
Quarterly debt variations alone are not sufficient to forecast the deficit for the current quarter. To obtain the deficit from the change in the Maastricht gross public debt, net acquisitions of financial assets and other accounts receivable and payable must also be taken into consideration, as well as the fact that the Maastricht debt is in nominal value. Moreover, the quarterly deficit published by INSEE is seasonally and trading-day adjusted, which is not the case of the quarterly debt.
The Maastricht debt increased by €40.7 billion compared to the previous quarter
At the end of Q1 2016, the Maastricht debt amounted to €2,137.6 billion, a €40.7 billion increase in comparison to Q4 2015. It accounted for 97.5% of GDP, 1.4 points higher than the Q4 2015's level. The net public debt increased more slowly (€ +17.9 billion).
State and social security funds debts went up
In the first quarter of 2016, the State contribution to the debt increased by €32.9 billion. This rise stemmed mainly from long-etrm negotiable debt (€ +32.9 billion). Short-term negociable debt went up more moderately (€ +1.9 billion). At the same time, the total amounts of long term loans increased by €0.9 billion. On the contrary, deposits to the French Treasury diminished by €2.9 billion.
Social security funds contribution to debt went up (€ +10.1 billion), above all because of ACOSS (€ +6.4 billion) which borrowed from units outside of general government to pay back €8.1 billion of negotiable debt held by the CADES (shares held by CADES are not included in Maastricht consolidated debt, see methodological note). Furthermore, UNEDIC indebted by €3.1 billion and CADES by €2.6 billion. Conversely, CNAF reduced its debts by €1.1 billion and CANSSM by €0.7 billion.
Local government and central agencies debts decreased
The contribution of local government went down (€ −2.3 billion). Municipalities repaid €1.4 billion and departments €0.9 billion. The contribution of other local government units (regions, intercommunal syndicates and local agencies) was stable.
Central agencies' contribution diminished by € −0.1 billion as the Commissariat à l'énergie atomique (CEA) paid back €0.1 billion of short-term loan.
graphiqueGraphIR – General government debt under the Maastricht treaty (% of GDP) (*)
tableauTableauA – General government debt under the Maastricht treatyby sub-sector and by category
| 2015Q1 | 2015Q2 | 2015Q3 | 2015Q4 | 2016Q1 | |
|---|---|---|---|---|---|
| General Government | 2,091.9 | 2,107.9 | 2,105.7 | 2,096.9 | 2,137.6 |
| %of GDP | 97.3% | 97.6% | 97.1% | 96.1% | 97.5% |
| of which, by sub-sector : | |||||
| State | 1,648.5 | 1,673.9 | 1,672.7 | 1,661.2 | 1,694.1 |
| Central Agencies | 22.1 | 22.1 | 22.1 | 18.9 | 18.9 |
| Local Government | 188.7 | 187.5 | 185.9 | 196.5 | 194.2 |
| Social security funds | 232.5 | 224.4 | 225.0 | 220.3 | 230.4 |
| of which, by category | |||||
| Currency and deposits | 38.3 | 41.0 | 41.7 | 39.2 | 36.4 |
| Securities other than shares | 1,762.5 | 1,778.1 | 1,774.8 | 1,760.7 | 1,812.6 |
| short-term | 213.6 | 191.7 | 189.7 | 177.2 | 187.4 |
| long-term | 1,548.9 | 1,586.4 | 1,585.1 | 1,583.5 | 1,625.2 |
| Loans | 291.1 | 288.8 | 289.3 | 296.9 | 288.6 |
| short-term | 17.6 | 15.2 | 14.0 | 14.6 | 14.1 |
| long-term | 273.5 | 273.6 | 275.2 | 282.3 | 274.5 |
- (*) Explanations in the box "For more details"
- Source : National Accounts, 2010 base - INSEE, DGFiP, Banque de France
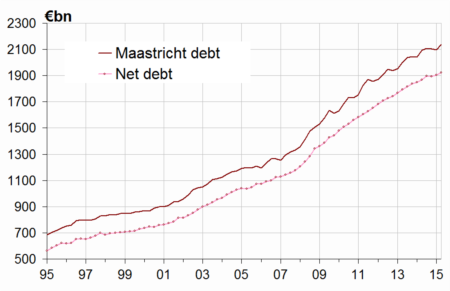
In Q1 2016, the net public debt increased by €17.9 billion
At the end of Q1 2016, the net public debt reached €1,922.8 billion (equivalent to 87.7% of GDP versus to 87.3% in Q4 2015), a €17.9 billion rise compared to the previous quarter. The € −22.8 billion gap between changes in net and gross debt is mainly explained by a sharp increase in the State's cash position (€ +18.3 billion) and in the cash position of social security funds (€ +4.6 billion). The cash position of central agencies rose slightly (€ +0.3 billion). Local government lent €0.3 billion. The State was reimbursed €0.7 billion of long-term loans.
tableauTableauB – General government net debt by sub-sector
| 2015Q1 | 2015Q2 | 2015Q3 | 2015Q4 | 2016Q1 | |
|---|---|---|---|---|---|
| General government | 1,867.6 | 1,895.9 | 1,894.5 | 1,904.9 | 1,922.8 |
| of which : | |||||
| The State | 1,518.1 | 1,551.8 | 1,553.8 | 1,556.7 | 1,572.1 |
| Central Agencies | 6.2 | 5.8 | 5.6 | 3.0 | 2.9 |
| Local government | 176.3 | 175.1 | 173.6 | 184.0 | 181.4 |
| Social security funds | 167.1 | 163.2 | 161.6 | 161.2 | 166.5 |
graphiqueGraph_dette_nette – Maastricht gross debt and net debt
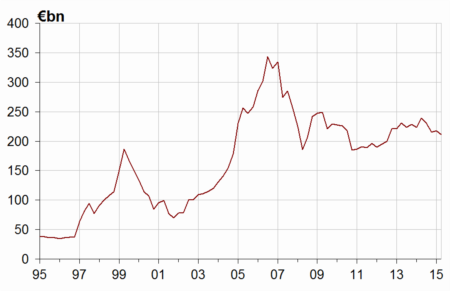
The overall value of quoted shares and mutual fund shares held by general government decreased
In Q1 2016, the value of quoted shares and mutual fund shares held by general government units went down to €211.1 billion, a €6.2 billion decrease compared to Q4 2015. The quoted shares held by the State lost €6.8 billion of value, mostly because of EDF and Engie shares depreciation. Conversely, The State borrowed €1.0 billion of Alstom shares from Bouygues. Concurrently, social security funds' shares lost €2.6 billion of value.
The value of mutual fund shares held went up by €2.1 billion, mainly due to UNEDIC (€ +3.1 billion). Conversely, the caisse nationale d'assurance vieillesse des professions libérales sold €0.4 billion of mutual fund shares. Finally, the value of various mutual fund shares held by the general government diminished by €0.7 billion thereby limiting the overall rise.
tableauTableauC – General government holdings of quoted shares and mutual fund shares
| 2015Q1 | 2015Q2 | 2015Q3 | 2015Q4 | 2016Q1 | |
|---|---|---|---|---|---|
| General government | 238.8 | 230.5 | 215.3 | 217.3 | 211.1 |
| of which : | |||||
| The State | 75.5 | 72.2 | 64.1 | 62.0 | 56.2 |
| Central Agencies | 35.1 | 33.9 | 31.2 | 31.6 | 31.6 |
| Local government | 0.2 | 0.2 | 0.2 | 0.2 | 0.2 |
| Social security funds | 128.0 | 124.2 | 119.8 | 123.5 | 123.1 |
graphiqueGraph_F5 – General government holdings of quoted shares and mutual fund shares
Pour en savoir plus
