


 30 May 2016
2016- n° 141In Q1 2016, consumption and investment sustained French GDP growth (+0.6%) Quarterly national accounts - second estimate - 1st Quarter 2016
30 May 2016
2016- n° 141In Q1 2016, consumption and investment sustained French GDP growth (+0.6%) Quarterly national accounts - second estimate - 1st Quarter 2016
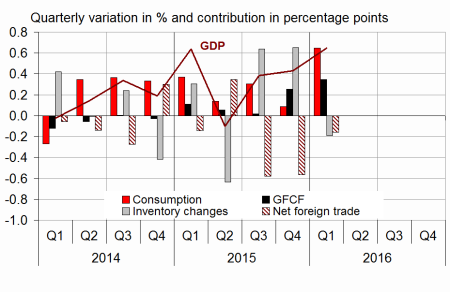
In Q1 2016, GDP in volume terms* increased by 0.6%, thereby revising the first estimate slightly upwards (+0.5%).
In Q1 2016, GDP in volume terms* increased by 0.6%, thereby revising the first estimate slightly upwards (+0.5%).
Household consumption expenditure recovered sharply (+1.0% after +0.0%). Total gross fixed capital formation (GFCF) accelerated (+1.6% after +1.2%). Overall, final domestic demand excluding inventory changes contributed for +1.0 points to GDP growth after +0.3 points in the end of 2015.
Exports stabilized (+0.0% after +0.8%), while imports slowed down (+0.6% after +2.5%). In fine, foreign trade balance contributed negatively to GDP growth (−0.2 points), but to a lesser extent than in the previous quarter (−0.6 points). Changes in inventories also contributed negatively (−0.2 points, after +0.7 points).

* This growth rate is seasonally and working-day adjusted; volumes are chain-linked previous-year-prices volumes.
tableauTab1 – Goods and services:supply and uses chain-linked volumes
| 2015 Q2 | 2015 Q3 | 2015 Q4 | 2016 Q1 | 2015 | 2016 (ovhg) | |
|---|---|---|---|---|---|---|
| GDP | -0.1 | 0.4 | 0.4 | 0.6 | 1.2 | 1.1 |
| Imports | 0.3 | 1.6 | 2.5 | 0.6 | 6.4 | 3.3 |
| Household consumption *expenditure | 0.1 | 0.4 | 0.0 | 1.0 | 1.5 | 1.3 |
| General government's *consumption expenditure | 0.3 | 0.3 | 0.4 | 0.4 | 1.4 | 0.9 |
| GFCF | 0.2 | 0.1 | 1.2 | 1.6 | 0.9 | 2.6 |
| *of which Non-financial corporated and unincorporated enterprises | 0.6 | 0.4 | 1.9 | 2.4 | 2.7 | 4.2 |
| Households | -0.3 | -0.2 | 0.0 | 0.3 | -0.8 | 0.1 |
| General government | -0.2 | -0.6 | 0.7 | 0.9 | -3.9 | 1.1 |
| Exports | 1.5 | -0.2 | 0.8 | 0.0 | 6.0 | 0.9 |
| Contributions : | ||||||
| Internal demand excluding inventory changes | 0.2 | 0.3 | 0.3 | 1.0 | 1.3 | 1.5 |
| Inventory changes | -0.6 | 0.6 | 0.7 | -0.2 | 0.2 | 0.5 |
| Net foreign trade | 0.3 | -0.6 | -0.6 | -0.2 | -0.3 | -0.8 |
- Source: INSEE
graphiqueGraph1 – GDP and its main components
- Source: INSEE
Total production ramped up slightly
Production in goods and services accelerated (+0.7% after +0.6%), notably in energy (+1.0% after +0.1%) and market services (+1.1% after +0.8%). In construction, output increased for the second quarter in a row (+0.5% after +0.4%). By contrast, it slowed down in manufacturing industry (+0.1% after +0.7%).
tableauTab3 – Production, consumption and GFCF: main components
| 2015 Q2 | 2015 Q3 | 2015 Q4 | 2016 Q1 | 2015 | 2016 (ovhg) | |
|---|---|---|---|---|---|---|
| Production of branches | -0.1 | 0.4 | 0.6 | 0.7 | 1.3 | 1.4 |
| Goods | -0.7 | 0.4 | 0.5 | 0.3 | 1.2 | 0.7 |
| Manufactured Industry | -0.5 | 0.4 | 0.7 | 0.1 | 1.5 | 0.7 |
| Construction | -0.5 | -0.5 | 0.4 | 0.5 | -2.2 | 0.4 |
| Market services | 0.1 | 0.6 | 0.8 | 1.1 | 1.8 | 2.0 |
| Non-market services | 0.2 | 0.2 | 0.3 | 0.3 | 1.0 | 0.8 |
| Household consumption | 0.1 | 0.4 | 0.0 | 1.0 | 1.5 | 1.3 |
| Food products | 0.8 | 0.0 | 0.2 | 0.4 | 1.2 | 0.7 |
| Energy | -2.4 | 2.1 | -2.6 | 1.6 | 1.4 | 0.0 |
| Engineered goods | 0.4 | 0.8 | 0.1 | 2.1 | 2.7 | 2.7 |
| Services | 0.1 | 0.4 | 0.3 | 0.7 | 1.0 | 1.2 |
| GFCF | 0.2 | 0.1 | 1.2 | 1.6 | 0.9 | 2.6 |
| Manufactured goods | 1.0 | 0.2 | 3.1 | 4.1 | 2.1 | 6.9 |
| Construction | -0.6 | -0.5 | 0.2 | 0.4 | -2.2 | 0.2 |
| Market services | 0.9 | 0.8 | 1.2 | 1.5 | 4.4 | 3.0 |
- Source: INSEE
Household consumption accelerated significantly
Household consumption expenditure increased strongly in Q1 2016 (+1.0% after +0.0%), mainly driven by the sharp rebound in expenditure on goods (+1.4% after −0.4%) and, to a lesser extent, by the acceleration in consumption of services (+0.7% after +0.3%). Consumption of engineered goods accelerated sharply (+2.1% after +0.1%), notably in housing equipment, car purchases and clothing. Similarly, energy expenditure bounced back (+1.6% after −2.6%), due to temperatures closer to seasonal norms than in autumn 2015.
The acceleration in household consumption of services stemmed mainly from a rebound in accommodation and food services and in services to households.
Investment accelerated sharply
In the first quarter of 2016, GFCF accelerated again (+1.6% after +1.2%). GFCF in manufactured goods' increased at a higher pace (+4.1%) than in the end of 2015 (+3.1%) especially in capital goods. To a lesser extent, investment in market services (+1.5% after +1.2%) and in construction (+0.4% after +0.2%) accelerated too.
Foreign trade balance put a drag on activity again, but less than in the fourth quarter
In Q1 2016, exports stagnated (after +0.8%): transport equipment sales fell back significantly while those of agri-food products rebounded. Imports slowed down sharply (+0.6% after +2.5%), notably because of the downturn in hydrocarbon purchases. Overall, foreign trade balance acted as a drag on GDP growth again, by 0.2 points in the first quarter (after a contribution of −0.6 points).
Changes in inventories contributed negatively to GDP growth
Changes in inventories contributed negatively to GDP growth: −0.2 points after +0.7 points in Q4 2015.
Revisions
Revisions are larger this quarter than in the previous publications, but their magnitude is typical at this time of year: they result from the benchmarking on annual accounts revised on years 2015 (GDP growth inchanged, at +1.2%, WDA), 2014 (+0.5 points at +0.7%) and 2013 (−0.1 points at +0.6%) and from updates of seasonal and working day adjustments. In Q1 2016, moreover, indicators known after the first estimate have been integrated.
tableauTab6 – Expenditure, receipts and net borrowing of public administrations
| 2015 Q2 | 2015 Q3 | 2015 Q4 | 2016 Q1 | 2015 | |
|---|---|---|---|---|---|
| In billions of euros | |||||
| Total expenditure | 312.1 | 311.4 | 310.3 | 1243.4 | |
| Total receipts | 290.4 | 291.1 | 295.2 | 1165.9 | |
| Net lending (+) or borrowing (-) | -21.7 | -20.3 | -15.2 | -77.5 | |
| In % of GDP | |||||
| Net lending (+) or borrowing (-) | -4.0 | -3.7 | -2.8 | -3.6 |
- Source: INSEE
tableauTab5 – Ratios of non-financial corporations' account
| 2015 Q2 | 2015 Q3 | 2015 Q4 | 2016 Q1 | 2015 | |
|---|---|---|---|---|---|
| Profit share | 31.0 | 31.3 | 31.7 | 31.4 | |
| Investment ratio | 22.9 | 22.8 | 23.0 | 22.9 | |
| Savings ratio | 19.3 | 19.9 | 20.2 | 19.7 | |
| Self-financing ratio | 84.2 | 87.4 | 87.7 | 86.3 |
- Source: INSEE
tableauTab4 – Households' disposable income and ratios of households' account
| 2015 Q2 | 2015 Q3 | 2015 Q4 | 2016 Q1 | 2015 | |
|---|---|---|---|---|---|
| HDI | 0.2 | 0.7 | 0.3 | 1.4 | |
| Household purchasing power | 0.0 | 0.8 | 0.3 | 1.6 | |
| HDI by CU* (purchasing power) | -0.2 | 0.7 | 0.2 | 1.2 | |
| Adjusted HDI (purchasing power) | 0.1 | 0.7 | 0.3 | 1.6 | |
| Saving rate (level) | 14.2 | 14.5 | 14.9 | 14.5 | |
| Financial saving rate (level) | 5.3 | 5.6 | 5.8 | 5.5 |
- *CU: consumption unit
- Source: INSEE
tableauTab2 – Sectoral accounts
| 2015 Q2 | 2015 Q3 | 2015 Q4 | 2016 Q1 | 2015 | |
|---|---|---|---|---|---|
| Profit ratio of NFC* (level) | 31.0 | 31.3 | 31.7 | 31.4 | |
| Household purchasing power | 0.0 | 0.8 | 0.3 | 1.6 |
- *NFC: non-financial corporations
- Source: INSEE
Pour en savoir plus
Time series : Operations on goods and services
Time series : Gross domestic product balance
Time series : Institutional sector accounts
Time series : Branch accounts
