


 30 May 2016
2016- n° 142Household consumption expenditure on goods was virtually stable in April 2016 (−0.1%) Household consumption expenditure on goods - April 2016
30 May 2016
2016- n° 142Household consumption expenditure on goods was virtually stable in April 2016 (−0.1%) Household consumption expenditure on goods - April 2016
In April 2016, household consumption expenditure on goods was virtually stable : -0.1% in volume*, after +1.1% in March. Expenditures on energy as well as on durables slowed down sharply. Consumption of food products dropped markedly.
In April 2016, household consumption expenditure on goods was virtually stable : −0.1% in volume*, after +1.1% in March. Expenditures on energy as well as on durables slowed down sharply. Consumption of food products dropped markedly.
Energy: decelerating significantly
In April, consumption of energy increased for the fourth consecutive month but it slowed down (+0.9% after +4.4%). Expenditure on electricity and gas decelerated while remaining vigorous (+3.3% after +6.2%), due to temperatures once again lower than seasonal norms.By contrast, consumption of refined products fell back (−2.2% after +2.1%), both in oil and diesel.
Engineered goods: more moderate growth
In April, purchases of engineered goods rose less sharply than in March (+0.3% after +0.9%), hampered by the decrease in car purchases.
Durables: decelerating substantially
In April, consumption of durables slowed (+0.4%) after two months of sharp growth. This deceleration results mainly from the downturn in car purchases (−0.8% after +1.1%). Expenditure on household durables remained dynamic (+2.3% after +4.0%), driven especially by purchases of consumer electronic products and furniture.

* Volumes are chained and all figures are trading days and seasonally adjusted.
graphiquegraph1_new_ang – Total consumption of goods
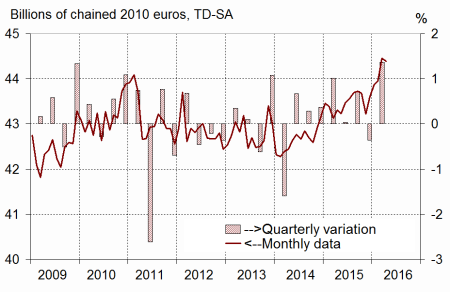
- Source: INSEE
graphiquegraph2_new_ang – Food and engineered goods
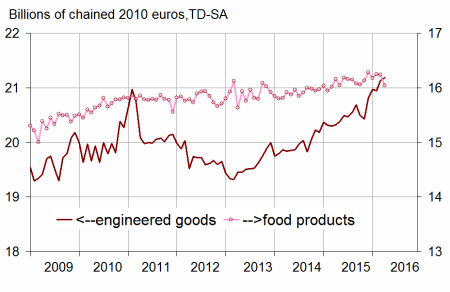
- Source: INSEE
graphiquegraph3_new_ang – Energy

- Source: INSEE
Textile-clothing: bouncing back slightly
In April, expenses on textile-clothing went up slightly anew (+0.2% after −0.3% in March), due notably to the rebound in shoes purchases.
Other engineered goods: recovering slightly
Household expenditure on other engineered goods edged up as well (+0.2% after −0.4%), particularly owing to the rebound in purchases of hardware.
Food products: marked decline
Consumption of food products dropped significantly in April (−1.2%) after a virtual stability in March (−0.1%). This decline is mainly due to a further decrease in meat consumption and a downturn in beverages and tobacco consumption.
The variation in March 2016 is revised upwards
The variation of household expenditure on goods in March 2016 has been revised upwards by 0.9 points: it now stands at +1.1%, instead of +0.2%. Conversely, the variation for the first quarter of 2016 has been revised downwards (+1.4% against +1.7%). The magnitude of these revisions is usual at this time of the year. It comes from the benchmarking of the quarterly accounts on the annual accounts, revised following the drawing up of the provisional account of the year 2015, from the reestimation of the seasonal and trading days adjustments coefficients and calibration models, as well as from the integration of new information known since the last publication (especially regarding textile-clothing and household durables).
graphiquegraph4_new_ang – Breakdown of engineered goods
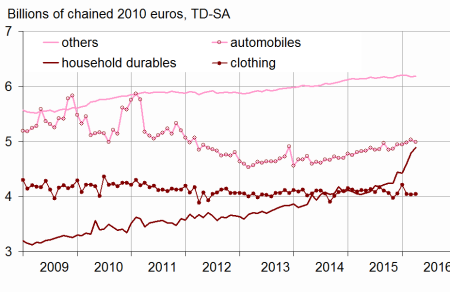
- Source: INSEE
tableautab1_eng – Household consumption expenditure on goods
| Weight (1) | Feb. 2016 | Mar. 2016 | Apr. 2016 | Apr. 16 / Apr. 15 | Q / Q-1 (2) | |
|---|---|---|---|---|---|---|
| Food products | 38 | 0.4 | –0.1 | –1.2 | –0.7 | –0.1 |
| Engineered goods | 45 | –0.1 | 0.9 | 0.3 | 4.2 | 1.7 |
| - Inc. Durables | 22 | 1.4 | 2.1 | 0.4 | 8.9 | 3.8 |
| - Automobiles | 12 | 0.7 | 1.1 | –0.8 | 3.5 | 1.6 |
| - Household durables | 7 | 3.8 | 4.0 | 2.3 | 21.0 | 8.8 |
| - Inc. Textile-clothing | 9 | –4.0 | –0.3 | 0.2 | –1.7 | –1.0 |
| - Inc. Other engineered goods | 13 | 0.0 | –0.4 | 0.2 | 0.8 | 0.1 |
| Energy | 17 | 0.7 | 4.4 | 0.9 | 5.1 | 5.4 |
| - Inc. Energy, water, waste | 10 | 0.2 | 6.2 | 3.3 | 9.8 | 9.3 |
| - Inc. Refined Products | 8 | 1.3 | 2.1 | –2.2 | –0.9 | 0.8 |
| Total | 100 | 0.2 | 1.1 | –0.1 | 2.5 | 1.6 |
| - Inc. Manufactured goods | 84 | 0.2 | 0.7 | –0.5 | 2.2 | 1.0 |
- (1) Weighting in the consumption expenditure on goods in 2015
- (2) Last three months / previous three months
Documentation
Methodology (pdf,23 Ko)
Pour en savoir plus
