


 15 June 2016
2016- n° 152Consumer prices increased by 0.4% in May 2016, they were stable year-on-year Consumer price index - final results - May 2016
15 June 2016
2016- n° 152Consumer prices increased by 0.4% in May 2016, they were stable year-on-year Consumer price index - final results - May 2016
In May 2016, the Consumer Prices Index (CPI) rose by 0.4% after +0.1% in April. Seasonally adjusted, it increased also by 0.4%. Year-on-year, the CPI was stable, after -0.2% in April.
Monthly change: +0.4%; Year-on-year: +0.0%
In May 2016, the Consumer Prices Index (CPI) rose by 0.4% after +0.1% in April. Seasonally adjusted, it increased also by 0.4%. Year-on-year, the CPI was stable, after −0.2% in April.
This rise in consumer prices in May came mainly from a price upturn in food, especially in fresh foodstuffs, and from a strengthening in petroleum product prices for the third month in a row. The increase in prices of other goods and services was very moderate.
A seasonal rebound significantly stronger in fresh foodstuff prices
In May 2016, food prices grew by 1.0% over the month (as year-on-year) after a stability in April. This acceleration came mainly from the seasonal rise in fresh foodstuff prices, more pronounced in May this year (+7.5%) than last year (+3.2%). In particular, prices of fruit increased at almost twice the growth rate of last year (+20.4% in May 2016 compared with +10.5% in May 2015) while new season products appeared. However, a portion of this difference (almost three pourcentage points) arose from a new method of calculation implemented through the CPI change of base (see explanatory note for details). In contrast, prices of processed products have been unchanged since the beginning of the year; their year-on-year rise remained limited to 0.2% for the sixth month in a row. Trends are more contrasted depending on the product. So, sugar prices declined by 4.6% year-on-year, those of ready-made meals by 3.9%, whereas those of dried fruits expanded by 4.7% and those of olive oil by 4.1%.
tableauT1IR_Eng – Detailed figures for various groups
| Items | Weight | Index | Percentage change | |
|---|---|---|---|---|
| 2016 | May 2016 | m-on-m change | y-on-y change | |
| a) All households | ||||
| OverAll | 10000 | 100.50 | 0.4 | 0.0 |
| Overall SA* | 10000 | 100.21 | 0.4 | 0.0 |
| Food | 1615 | 101.39 | 1.0 | 1.0 |
| Fresh food | 217 | 109.75 | 7.5 | 5.8 |
| Other food | 1398 | 100.08 | 0.0 | 0.2 |
| Tobacco | 195 | 100.09 | 0.0 | 0.0 |
| Manufactured products | 2651 | 100.53 | 0.1 | −0.6 |
| Clothing and footwear | 414 | 105.28 | 0.8 | 0.2 |
| Medical products | 466 | 97.08 | −0.3 | −3.5 |
| Other manufactured products | 1771 | 100.26 | 0.1 | −0.1 |
| Energy | 773 | 97.24 | 2.2 | −5.7 |
| Petroleum products | 419 | 95.39 | 4.1 | −10.4 |
| Services | 4766 | 100.77 | 0.1 | 1.0 |
| Actual rentals and services for dwellings | 768 | 100.62 | 0.0 | 1.1 |
| Medical services | 598 | 100.39 | 0.0 | 0.2 |
| Transport | 279 | 96.31 | −1.1 | −3.2 |
| Communication | 245 | 102.47 | 0.7 | 2.7 |
| Other services | 2876 | 101.18 | 0.2 | 1.4 |
| Total except rents and tobacco | 9183 | 100.52 | 0.4 | 0.0 |
| Total except tobacco | 9805 | 100.51 | 0.4 | 0.0 |
| b) Urban working-class households or households of employees | ||||
| All products excluding tobacco | 9704 | 100.51 | 0.4 | 0.0 |
| c) Households that belong to the lowest equivalized disposable income quintile - France | ||||
| All products excluding tobacco | 9696 | 100.31 | 0.4 | −0.2 |
- *: seasonally adjusted
- Geographical coverage: France excluding Mayotte
- Source: INSEE - Consumer Price Indexes
Further strengthening in energy prices
The energy prices rose sharply in May (+2.2%) after more moderate increases during the last two months (+0.3% in April and +0.9% in March). However, they remained far below their level of last year (−5.7%). This strenghthening was due to petroleum products (+4.1%; −10.4% year-on-year), in the wake of the rise in crude oil prices. Conversely, gas prices were still down (−0.6%; −10.5% year-on-year) while electricity fares were stable (+4.1% year-on-year).
Moderate growth in service prices
In May 2016, services prices grew slightly (+0.1% after +0.2% in April; +1.0% year on year as in April). In hotels and restaurants, prices rose seasonally at the beginning of the summer season (+0.3% over one month; +1.8% year-on-year). Furthermore, mobile phone services continued to increase in May (+1.4% over one month; +4.7% year-on-year). On the other hand, package holidays prices dropped after spring break (−3.6% over one month; +1.6% year on year), as airfares (−3.1% over one month; −7.3% over one year). Insurance premiums went down slightly (−0.4% over one month; +1.7% year on year) due to discounts.
Small rises increase in manufactured products prices
In May 2016, prices of manufactured goods rose slightly (+0.1%) but remained down year-on-year (−0.6%). Clothing and footwear prices increased at a faster pace than in April (+0.8% after +0.4%; +0.2% year-on-year), with the launch of the summer collections. In addition, prices of the other manufactured products grew slightly in May (+0.1%; −0.1% year on year) due to the end of discounts, particularly for furniture and furnishings.
Slight rise in core inflation
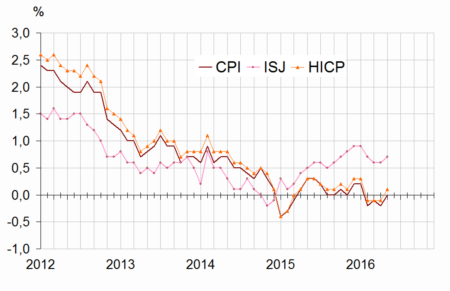
In May 2016, the core inflation indicator (ISJ) grew by 0.1% for the third month in a row. Year-on-year, it increased by 0.7% (after +0.6% in the two previous month). The Harmonised Index of Consumer Prices (HICP) expanded by 0.5% over a month in May. Year-on-year, it increased by 0.1% after three months of decline (−0.1%).
graphiqueGraphiqueIR_English – Consumer price index (CPI), core inflation (ISJ)* and Harmonised Indices of Consumer Prices (HICP)** year-on-year changes
tableauT2IR_Eng – Detailed figures for Core inflation* and HICP**
| Items | Weight | Index | Percentage change | |
|---|---|---|---|---|
| 2016 | May 2016 | m-on-m change | y-on-y change | |
| Core inflation - All items | 6075 | 100.67 | 0.1 | 0.7 |
| Food excluding fresh products, meat, milk and exotic products | 735 | 99.99 | 0.0 | 0.0 |
| Manufactured products | 2136 | 100.17 | 0.1 | −0.1 |
| Services including actual rentals and services for dwellings | 3204 | 101.17 | 0.2 | 1.3 |
| HICP - All items | 100.65 | 0.5 | 0.1 | |
- *Core inflation indicator excludes public sector prices, the most volatile consumer prices and the tax measures. Seasonally adjusted, this index is calculated for all households in France excluding overseas departments and territories (in French “indice d'inflation sous-jacent - ISJ”).
- **HICP: Harmonised Indices of Consumer Prices are inflation figures designed for international comparison of consumer price inflation between Member states of the European Union. This index is calculated for all households in France excluding Mayotte.
- Source: INSEE - Consumer Price Indexes
Revisions
Compared to the provisional estimates published at the end of last month, the annual rates of change in the CPI and HICP were revised upwards by 0.1 percentage points in May (respectively from −0.1% to 0.0% and from 0.0% to +0.1%). These revisions came mainly from integration of information in the meantime leading to raised the price rise estimates for petroleum products and for telecom services.
Documentation
Methodology (pdf,141 Ko)
Pour en savoir plus
